
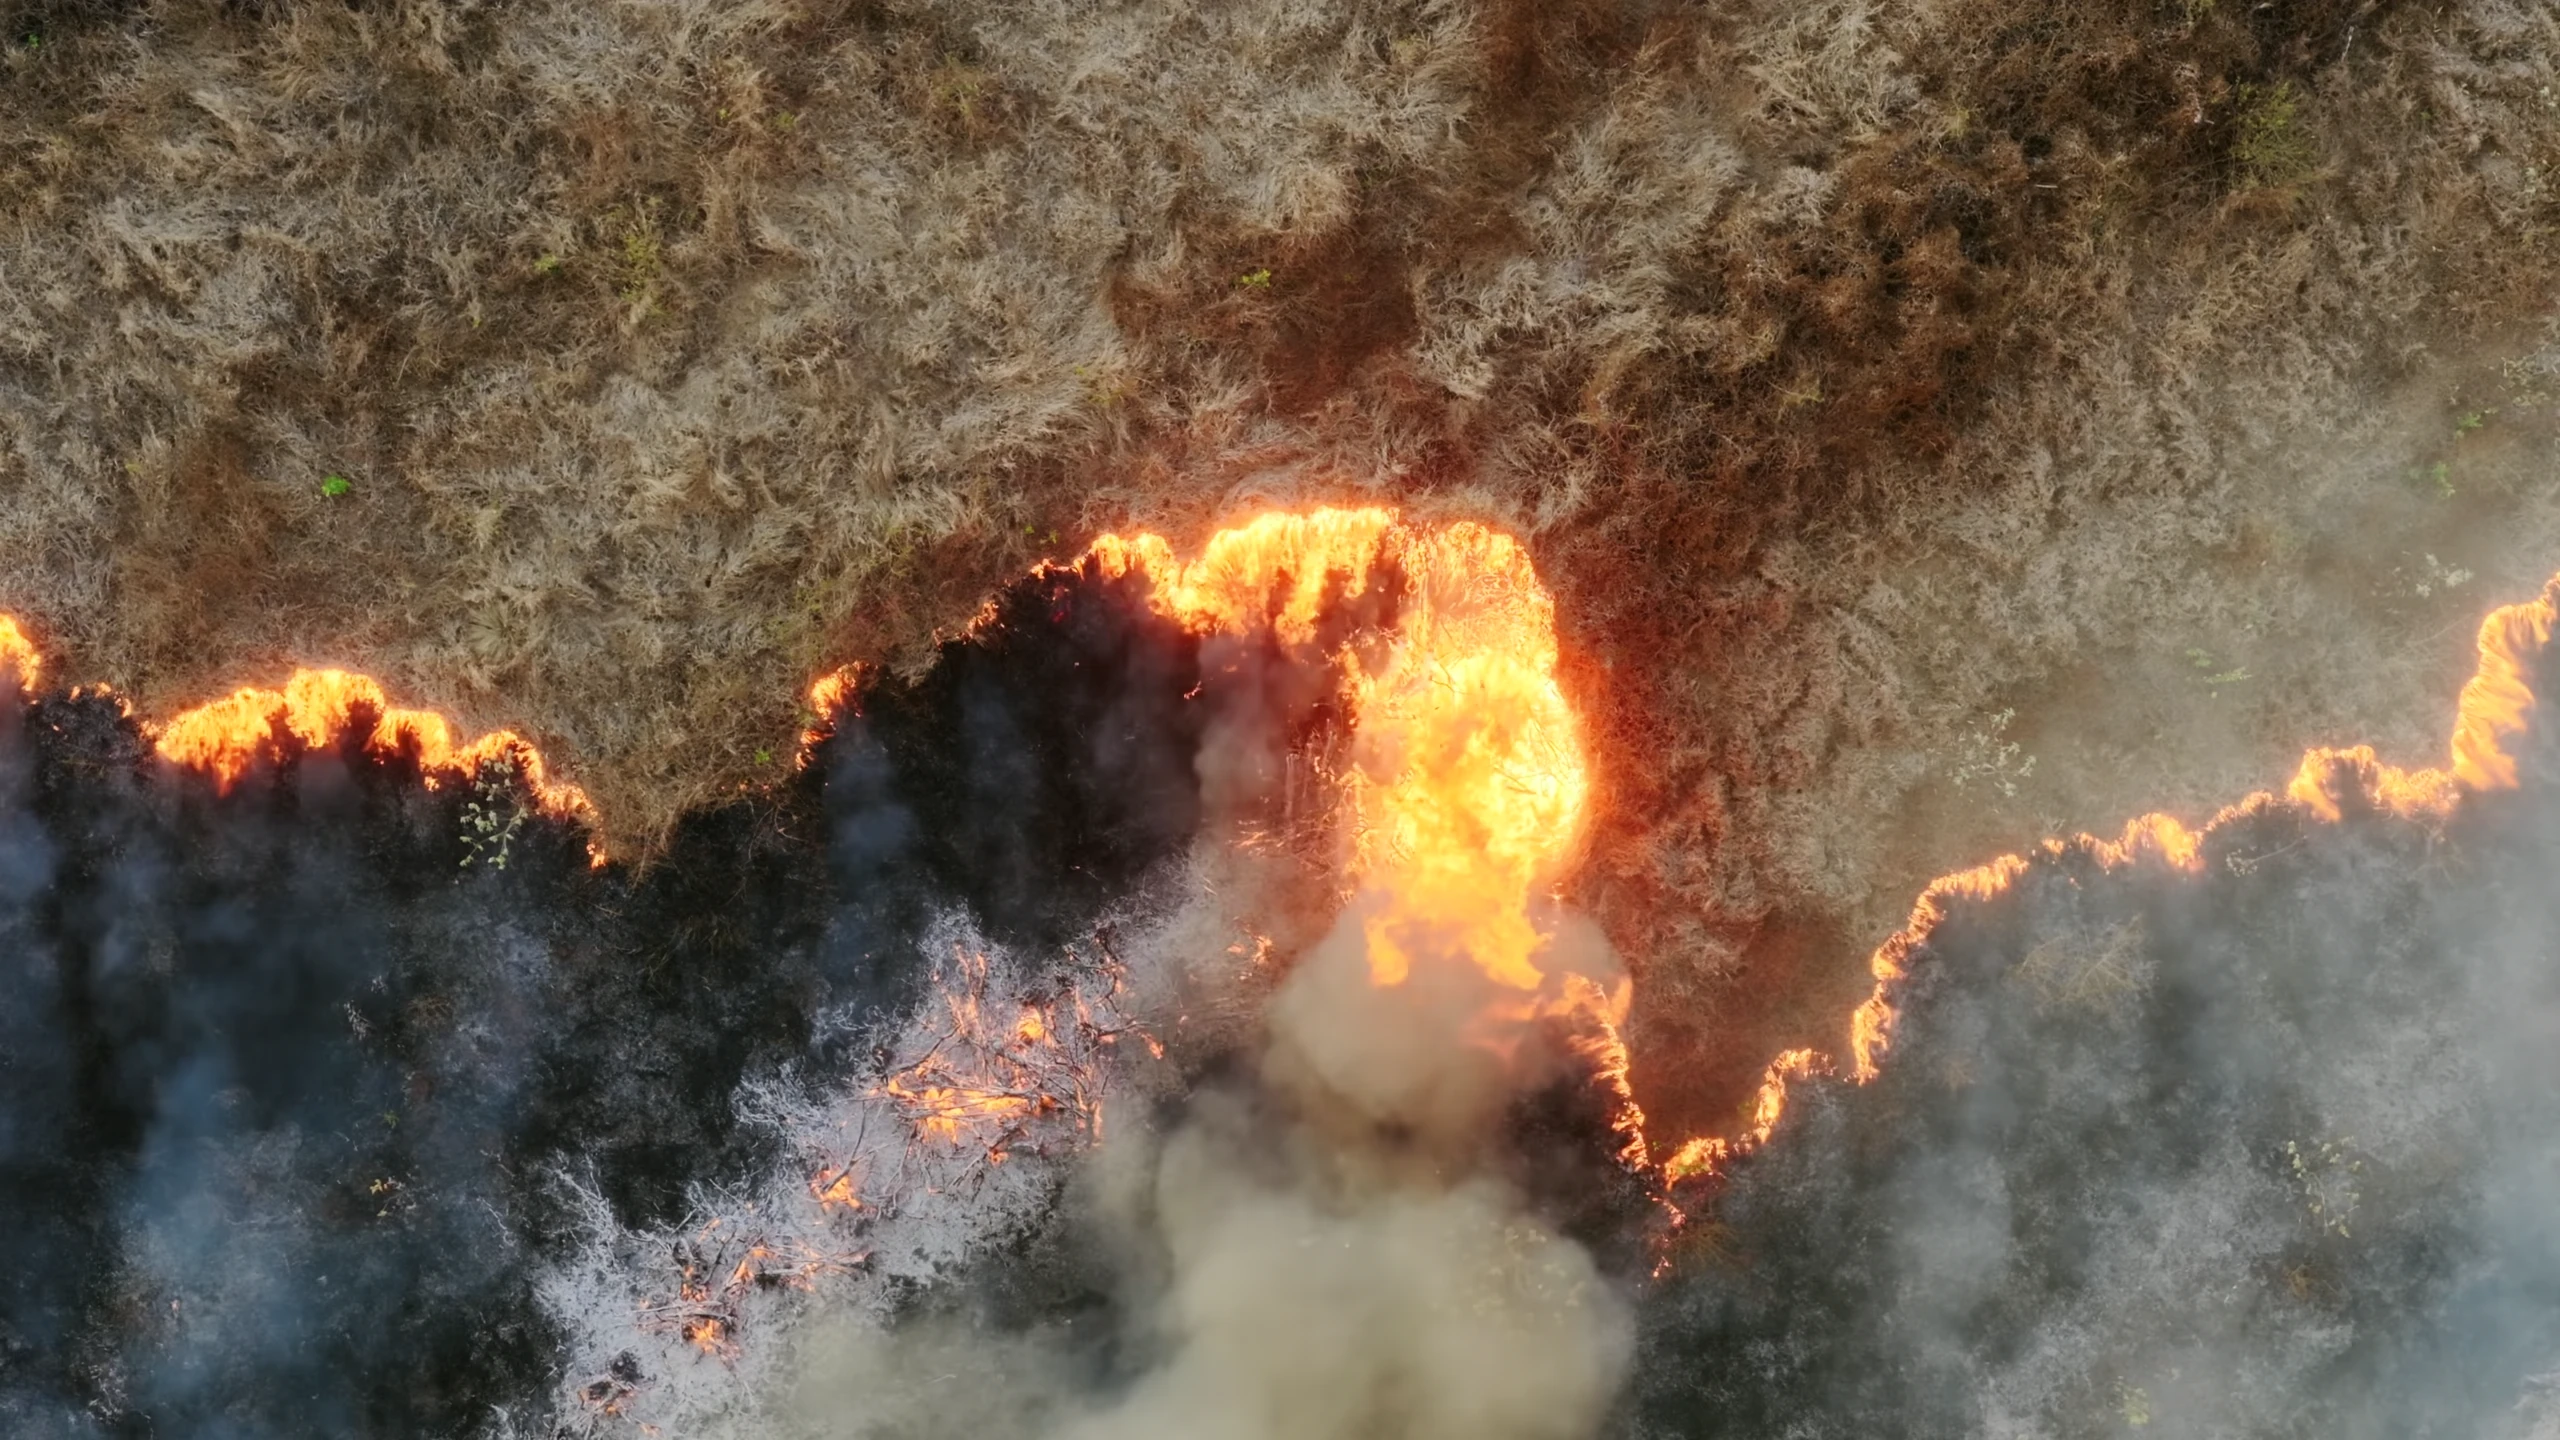











Physical climate risk, translated into financial consequence.
Alpha-Klima quantifies the damage, disruption and ongoing costs a changing climate imposes on physical assets, one site or a whole portfolio, and what it means for financial materiality and disclosure.
Free to enter with a Google account, including sample hazards and example analyses.
Trusted by
Riverine floodRCP 4.52030–2035
Exceedance Probability
400+ asset-specific vulnerability models for damage, disruption and ongoing costs
Vulnerability models
Hazard data is a commodity. What it does to your asset is not.
Assets exposed to the same flood do not lose the same amount of money. What separates them is the vulnerability model: what the asset is made of, what it does, and what stops when the water arrives.
Our models cover a large inventory of damage, disruption and OPEX functions mapped to occupancy and construction class, with a class-level fallback where an asset’s detail is thin. Damage to the structure is kept separate from loss of function, so business interruption or operational costs are not buried inside a repair estimate.
Portfolio aggregation
A portfolio tail is not the sum of its parts.
A portfolio’s tail is not the sum of its assets’ tails. One event can hit many locations at once, and different hazards can co-occur or compound each other.
We model asset losses as distributions, then aggregate them through hazard-specific spatial dependence and cross-hazard dependence. The result is a portfolio loss distribution that captures concentration and compounding, supporting Annual Average Loss, Value at Risk and Expected Shortfall at portfolio level.
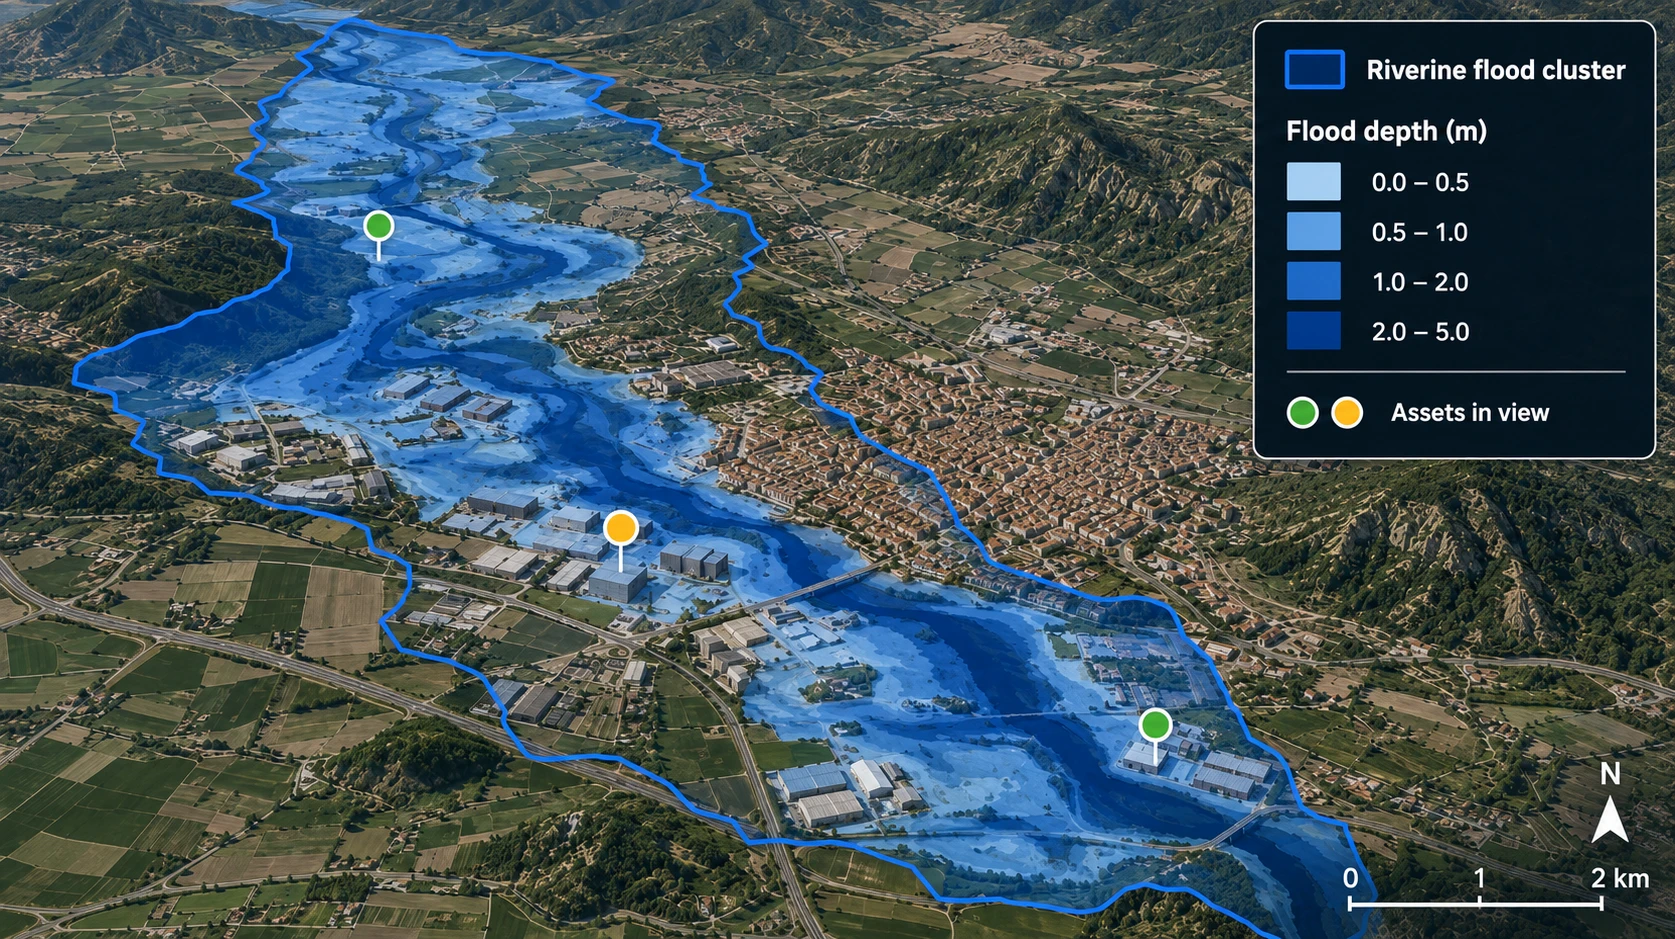
7 acute & chronic hazards integrated into a spatially dependent portfolio risk model
-
Reported result
AAL · Value at Risk · Expected shortfall · PD · Adaptation ROI
-
Aggregation
Spatial dependence, cluster and portfolio level
-
Impact
A distribution, not a point estimate
-
Vulnerability
Function, asset class and the study behind it
-
Hazard
Dataset, model version, scenario, horizon
4 layers of traceability from source data to reported result
Auditability
Numbers that stand up to scrutiny.
A number that cannot be explained will not survive an auditor, supervisor or internal validation team. Every figure we report retains the data, model version, scenario, horizon, assumptions, vulnerability logic and aggregation methodology behind it.
That traceability makes the same analytical foundation usable across risk management, disclosure, assurance and regulatory workflows, from global frameworks to jurisdiction-specific requirements.
One analysis, many frameworks
- IFRS S2
- Basel Pillar 3
- CSRD and ESRS E1
- CRR/EBA Pillar 3
- Solvency II/EIOPA ORSA
- EU Taxonomy
Client work
What clients value in the work

Alpha-Klima's work gave us a physical climate risk view of our banking book that is proportional, methodologically defensible, and traceable down to individual exposures. We particularly valued the rigour of the geolocation approach and the clarity of the documentation supporting each output.

A forward-looking, actionable assessment at the asset level is key to anticipating the impacts of climate change and effectively strengthening the resilience of our logistics portfolio.
Ways to work with us
Use it yourself, call it from your stack, or work with our team on your portfolio
-
Self-serve
The platform
Assess a single asset through a guided workflow, or upload a portfolio and read aggregated loss, spatial concentration and the standard tail metrics.
See what the platform does ↗ -
Integrate
The API
Automate repeatable, high-volume analysis inside your own data workflow, or drive selected calculation stages and work with the intermediate results per asset.
Read the API capabilities ↗ -
Bespoke
Full engagement
We research where your exposure physically sits, calibrate vulnerability to those assets, and carry the loss through to PD, valuation, insurance or the adaptation business case – inside the framework you already run, documented to survive review.
Talk to the team ↗
Learn more
Climate-risk work, research and insights
See how we apply climate-risk analysis in client engagements, investigate emerging physical-risk questions and interpret new climate evidence and supervisory guidance.
Aresbank: Physical climate risk across the banking book
A practical case study of portfolio-level physical climate-risk assessment for an international banking book.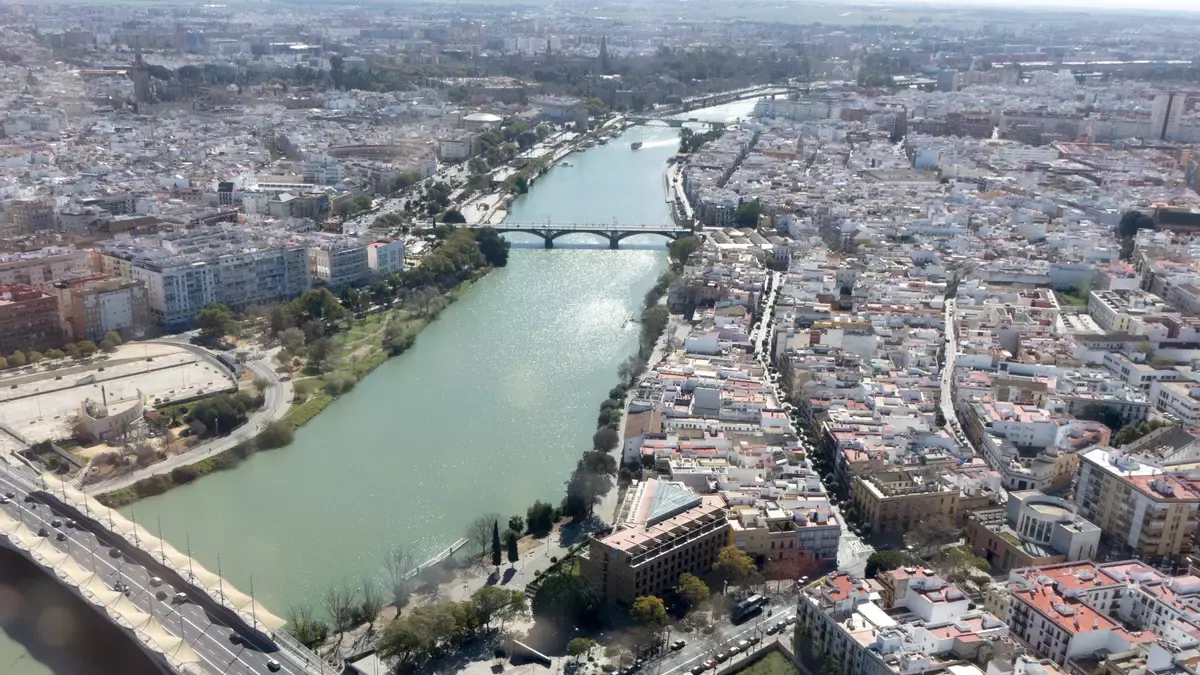
Seville fluvial flood risk and the insurance gap
A forward-looking assessment of fluvial flood risk in Seville, combining postcode-level exposure, climate scenarios and insurance portfolio analysis.Next step