
Publication ·
From physical climate risk to project economics: When does adaptation pay?
How Alpha-Klima's Adapta and Project Finance modules connect climate risk, adaptation measures and investment metrics.
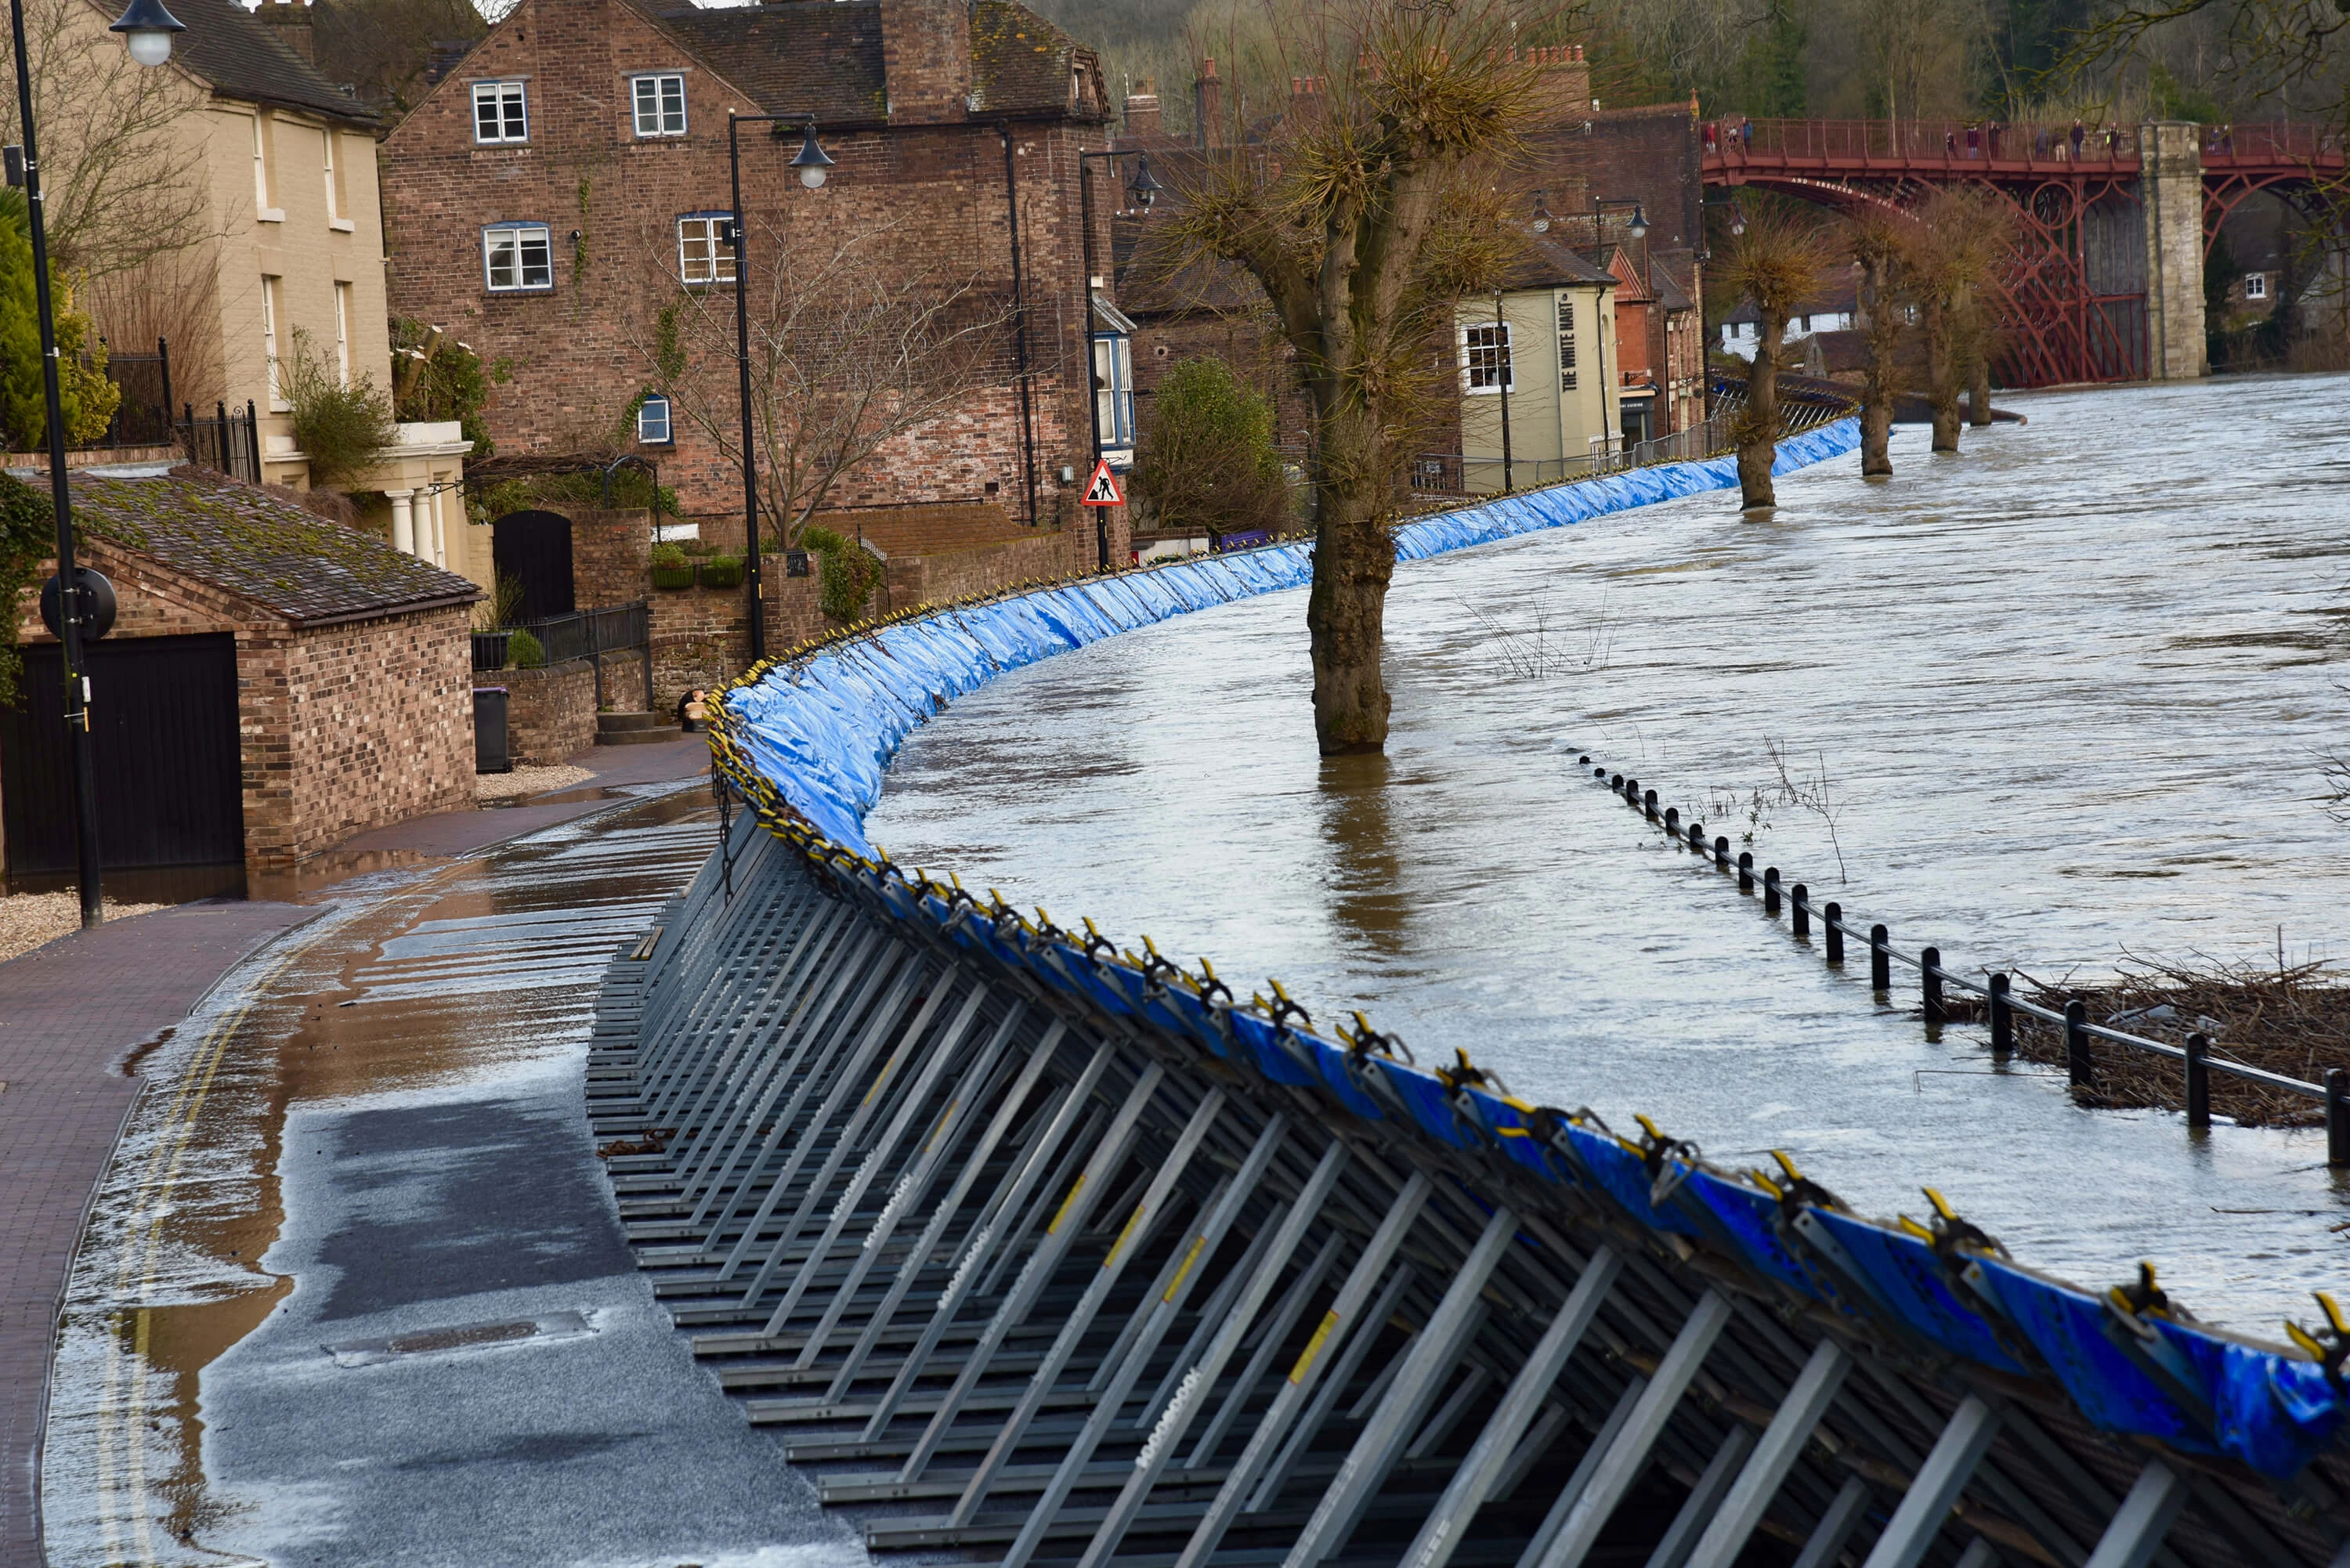
Physical climate risk is often presented as a map, a score or an expected-loss estimate. Those outputs are useful, but they do not always answer an investment question directly.
For an investor, lender, developer or asset owner, the practical question is sharper: how does climate risk change the economics of a specific project, and is it worth paying for an adaptation measure?
Alpha-Klima’s Adapta and Project Finance modules address these questions from complementary perspectives. Adapta quantifies how adaptation measures modify physical climate risk at the asset level and can be used independently within any physical-risk assessment. The Project Finance module translates physical climate impacts into project cash flows and financial metrics such as net present value (NPV), internal rate of return (IRR) and payback.
When used together, the modules allow adaptation measures to be assessed financially, linking their costs and avoided losses to metrics such as benefit-cost ratios and project-value uplift.
This article illustrates the workflow through a synthetic example: a logistics warehouse in the Ebro corridor, exposed to river flooding and assessed as a long-term project-finance investment. Expected river-flood losses take almost 90% of the project’s net present value. A flood-protection package wins back part of that value, avoiding about €1.40 of losses for every euro it costs.
Key findings
- Expected river-flood losses cut the project’s NPV by almost 90% and nearly double its payback period, compared with a conventional appraisal that ignores climate risk. The project still earns more than its cost of capital, but equity returns fall below the 9% shareholders require.
- In the first year, expected flood damage takes about a third of what the warehouse earns after operating costs. Over 25 years, it adds up to about three-fifths of the building’s replacement value.
- Perimeter flood barriers and protection for loading doors, costing about 5% of the initial investment up front, avoid almost a fifth of expected losses and recover about 6% of the NPV lost to flooding.
Module overview
Adapta
The Adapta module evaluates how adaptation measures can change physical climate risk.
Given an asset, with its location and relevant characteristics, users can define adaptation measures for that asset. These measures modify the vulnerability curves, reducing physical impacts. The module allows users to consider different types and effects of adaptation measures, simulating real-world scenarios based on each climate risk. Finally, the module compares the results with and without adaptation measures to evaluate their performance and assess their cost-benefit ratio in each case.
Project Finance
The Project Finance module represents an asset as an investment project and integrates physical climate risk directly into its financial model.
The user defines financial assumptions such as initial investment cost, revenues, operating expenditure and financing, together with the usual asset information required for physical-risk assessment. The module then builds the project cash flows and calculates financial metrics such as NPV, project IRR, equity IRR, payback and debt-service indicators, while incorporating physical climate impacts directly into those cash flows.
Both modules can be combined when a project-finance analysis also considers adaptation measures. Each measure introduces its own CAPEX and OPEX while reducing future expected physical losses. Combining both modules makes it possible to assess whether an adaptation investment generates value, by comparing its costs with the losses it prevents over the project’s lifetime.
Synthetic example
The example considers a synthetic medium-sized logistics warehouse in an industrial area of Zaragoza, near the Ebro corridor, designed to resemble the area’s logistics assets in size, use and flood exposure. River flooding has a direct link to project economics: flood water can damage the building, disrupt operations and require repair or replacement spending. Only the building damage is modelled in this example, not lost revenue.
The project is assessed from 2035 to 2059. The warehouse has an initial investment cost of €18.5 million, and revenues and operating costs grow with a 2% CPI assumption. The analysis uses a project-finance-style capital structure with 55% debt and 45% equity. Further details of the example and results are provided below in the technical appendix.
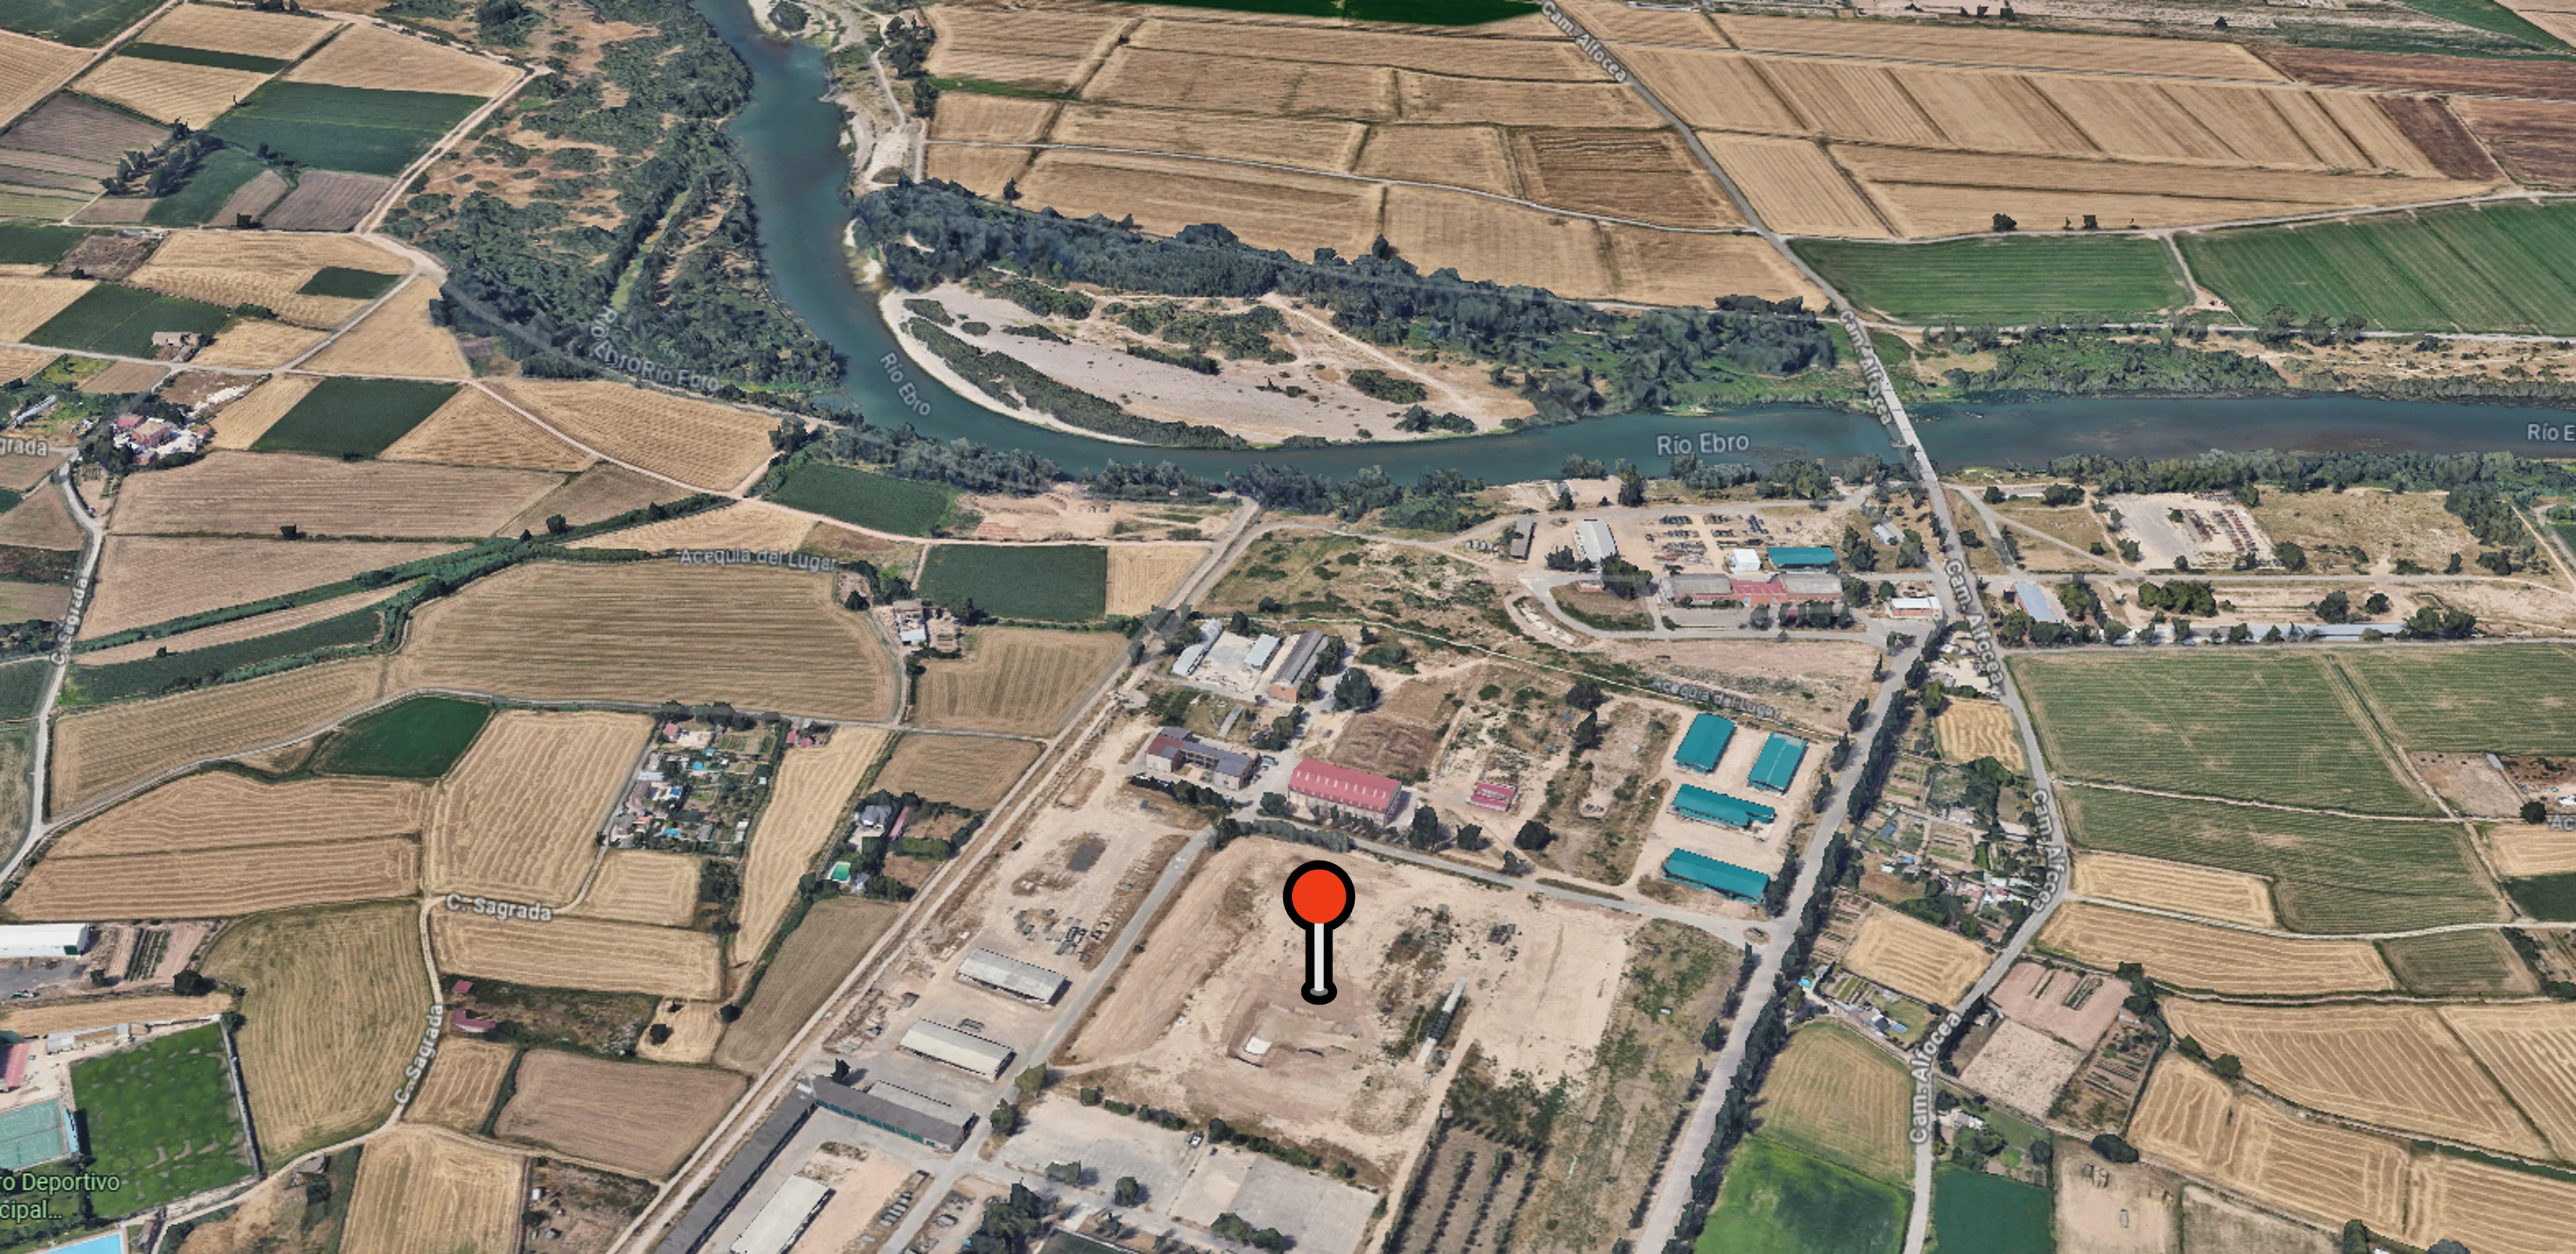
The flood hazard comes from a pan-European river-flood dataset under a high-emissions pathway (RCP8.5). A vulnerability model for European industrial buildings turns the flood depth at the site into expected damage, as a share of the building’s replacement value, and the Project Finance module carries that damage into the project’s cash flows. The three cases below differ only in how flood risk is treated: the first ignores it, the second adds expected flood losses, and the third adds an adaptation measure as well.
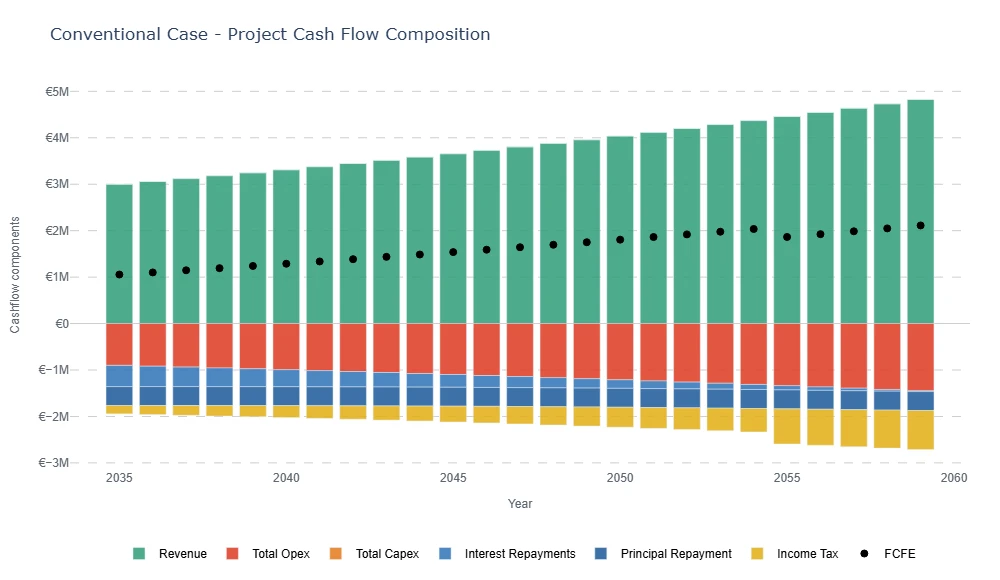
Conventional case: An attractive investment
The first case appraises the warehouse the conventional way, without explicit flood losses. On that view it is an attractive investment, with a positive NPV and a payback within the first third of its modelled life:
| Metric | Conventional case |
|---|---|
| Enterprise NPV | €8.74m |
| Project IRR | 10.11% |
| Equity IRR | 15.53% |
| Payback | 7.0 years |
Climate-adjusted case: Flood losses erase most of the NPV
The second case introduces river-flood risk into the same project.
The Project Finance module evaluates the flood hazard at the asset location, applies the relevant industrial real-estate flood vulnerability curve and estimates annual expected damage fractions. Those damage fractions are converted into monetary losses using the asset’s exposed replacement value and incorporated into project cash flows.
Across the 25-year horizon, the modelled undiscounted flood losses amount to about three-fifths of the building’s replacement value.
Once these losses are included, the project remains viable, but keeps only about an eighth of its NPV:
| Metric | Conventional case | Climate-adjusted case |
|---|---|---|
| Enterprise NPV | €8.74m | €1.12m |
| Project IRR | 10.11% | 6.46% |
| Equity IRR | 15.53% | 8.72% |
| Payback | 7.0 years | 13.0 years |
| Delta NPV vs conventional | – | −€7.62m |
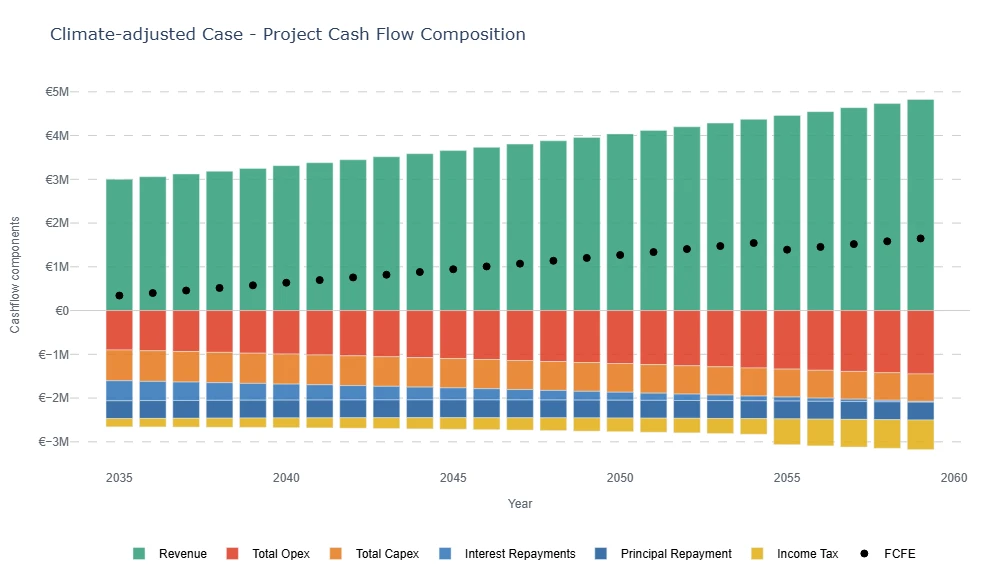
Climate-adjusted NPV is still positive, but much lower, and the payback period almost doubles. Equity IRR falls further than project IRR, because debt service stays fixed while the losses come out of the cash left for shareholders, and it drops below the 9% they require in this example. The key point is that the conventional view materially overstates the project’s risk-adjusted economics.
Adapted case: Protection returns part of the lost value
The third case introduces a flood-adaptation measure: perimeter flood barriers combined with protection for loading doors and other vulnerable openings.
This is a practical site-level package. It requires an upfront investment and ongoing maintenance. In the example, the measure costs about 5% of the project’s initial investment, with a small annual OPEX for inspection and maintenance. The measure reduces expected damage by modifying the flood impact curve used in the physical-risk calculation, so the financial model can compare the cost of adaptation with the losses avoided.
After applying the adaptation measure, expected flood losses fall by almost a fifth every year, and the project-finance metrics improve relative to the climate-adjusted case:
| Metric | Conventional case | Climate-adjusted case | Adapted case |
|---|---|---|---|
| Enterprise NPV | €8.74m | €1.12m | €1.55m |
| Project IRR | 10.11% | 6.46% | 6.64% |
| Equity IRR | 15.53% | 8.72% | 8.92% |
| Payback | 7.0 years | 13.0 years | 12.0 years |
| Delta NPV vs conventional | – | −€7.62m | −€7.19m |
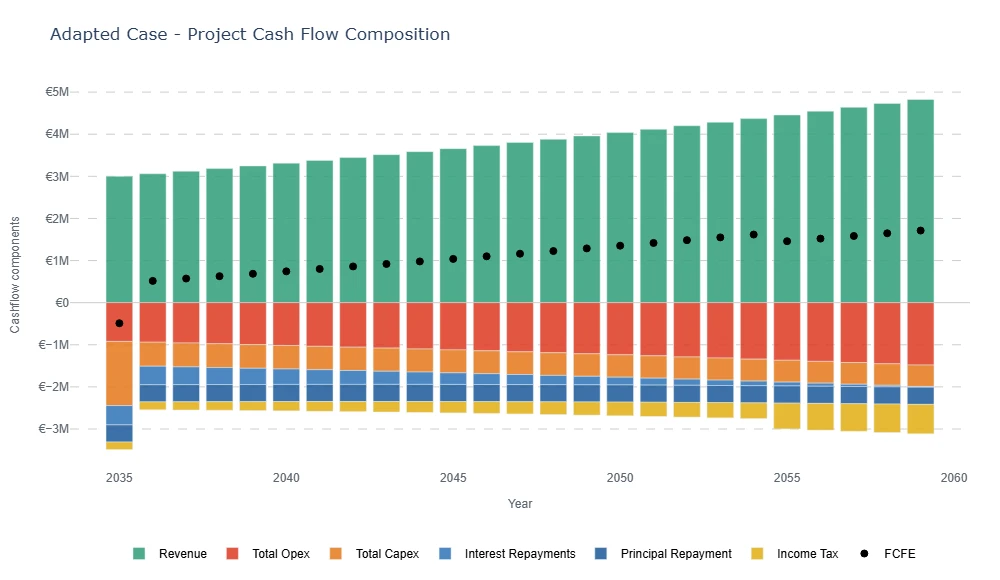
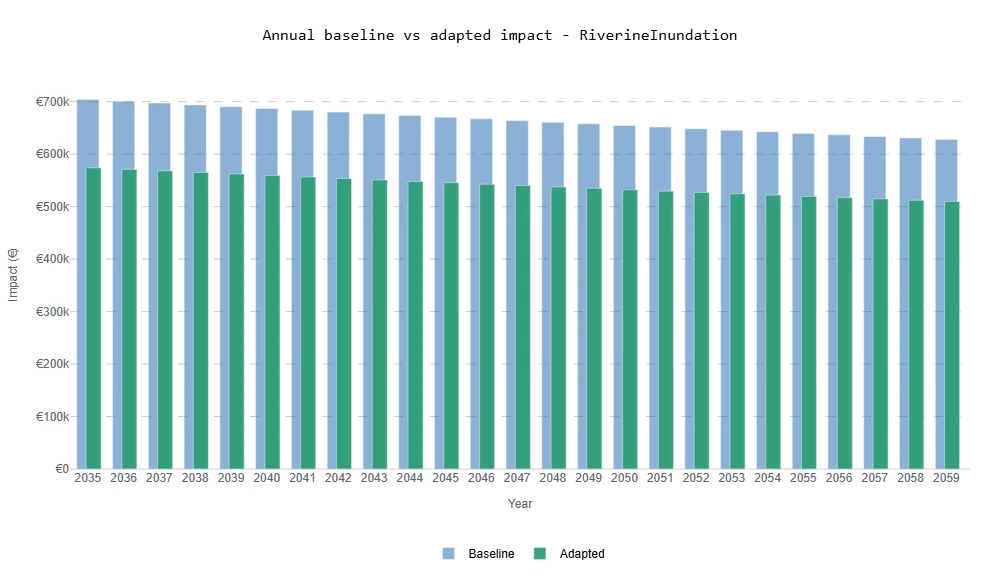
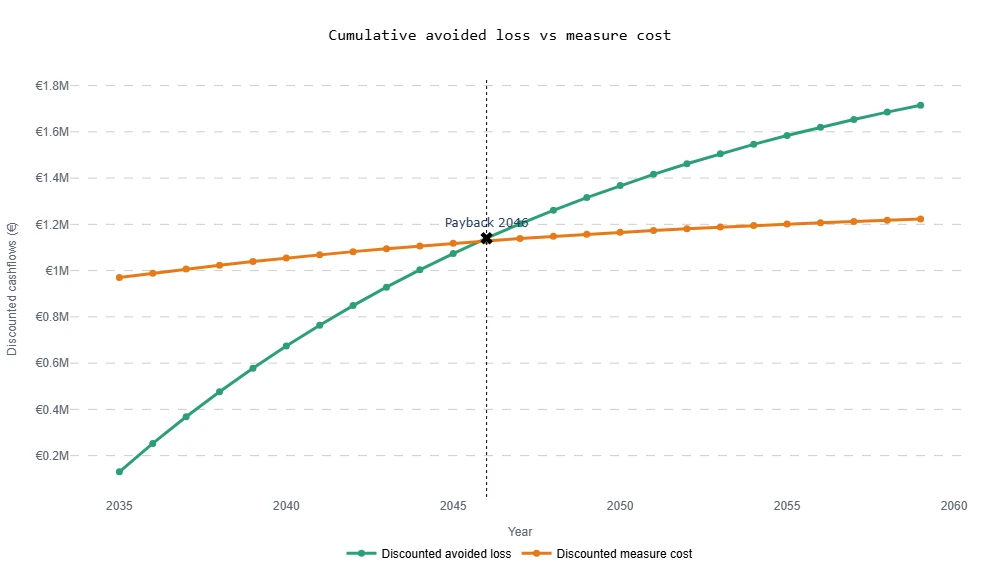
The adaptation measure recovers about 6% of the project value lost to physical climate risk, but it does not bring the project back to the conventional no-risk valuation. Even so, it pays for itself: every euro spent on it avoids about €1.40 of flood losses in present-value terms. Adaptation is economically useful in this example, while still leaving residual risk in the project.
What this means for investors and lenders
A conventional appraisal can make an exposed project look far safer than it is. In this example the gap between the two views is most of the project’s NPV, and it stays invisible until physical losses enter the cash flows.
Measured this way, adaptation becomes an investment decision like any other. Its costs and avoided losses sit on the same basis as the project, so a measure can be compared with alternatives, or with no action, before the money is committed.
The residual risk matters as much as the measure. Here most of the expected loss remains after adaptation, so investors and lenders still need to decide how much of it to insure, how much to price into returns and financing terms, and whether the site suits the investment at all.
The combined Adapta and Project Finance workflow makes climate analysis auditable. The result can be traced from hazard indicator to vulnerability curve, from expected physical damage to monetary loss, and from monetary loss to NPV, IRR, payback and adaptation metrics.
Explore the analysis
The Alpha-Klima notebooks repository works through physical-risk analyses in Python. Its adaptation notebooks cover the Adapta side of this workflow for logistics assets, from hazard data to expected damage and the cost-benefit of adaptation measures. They can be read on GitHub; running them requires an Alpha-Klima API key.
The Alpha-Klima methodology documentation explains how hazard, vulnerability and financial impact connect at each stage of the assessment, and the adaptation and risk-transfer methodology explains how measures and insurance change the losses an asset retains.
Is protection worth its cost for your own assets? Book a demo to see how Alpha-Klima’s platform carries flood risk and adaptation measures into your project’s cash flows, using your own sites, financing assumptions and investment criteria.
Request a project-finance and adaptation demo
Technical appendix
This synthetic example was built to demonstrate the Adapta and Project Finance modules and does not describe a real project.
Inputs
| Input | Value |
|---|---|
| Location | Industrial plot in Zaragoza, 41.7051°N, 0.9571°W |
| Asset | Industrial logistics building, replacement value €28.0m |
| Hazard | River-flood depth under RCP8.5; losses computed for 2035 and 2085 and interpolated for the years between |
| Vulnerability | European industrial-building flood damage curve |
| Horizon | 2035–2059, 25 annual periods |
| Investment and operations | €18.5m initial investment; first-year revenue €3.0m and OPEX €0.9m, both rising with 2% CPI |
| Financing | 55% debt at 4.5%, amortised over 20 years; 45% equity at a 9% cost of equity; WACC 5.91% |
| Tax | 25% corporate income tax |
| Adaptation measure | Perimeter barriers and protected openings, modelled as a cap on flood damage at 30% of replacement value; €0.95m CAPEX plus €20,000 a year OPEX |
Results
The project metrics for all three cases are in the adapted-case table. The measure’s own economics:
| Result | Value |
|---|---|
| Flood losses without the measure, undiscounted | €16.62m |
| Losses avoided by the measure, undiscounted | €3.10m |
| Present value of avoided losses | €1.72m |
| Present value of measure costs | €1.22m |
| Benefit-cost ratio | 1.40 |
| Measure NPV | €0.49m |
| Gain in project NPV | €0.43m |
| Gain in project IRR | 0.18 percentage points |
| Discounted payback of the measure | 2046 |
Expected annual losses ease from €0.70m in 2035 to €0.63m in 2059, and the measure cuts each year’s loss by 18.5–18.8%. Present values use the project’s WACC as the discount rate.
Data sources
- Paprotny, D. and Morales Nápoles, O. (2016), Pan-European data sets of river flood probability of occurrence under present and future climate, 4TU.ResearchData – river flood depth under RCP8.5.
- Huizinga, J., de Moel, H. and Szewczyk, W. (2017), Global flood depth-damage functions, European Commission Joint Research Centre – the European industrial building damage curve.
- Header image: Geodesign Barriers - Ironbridge 2022.jpg by GeodesignBarriers, licensed under CC BY-SA 4.0. Optimised for web delivery; no endorsement implied.