Case study ·
Physical climate risk in a Brazilian credit book: From CRFR2 reporting to credit risk
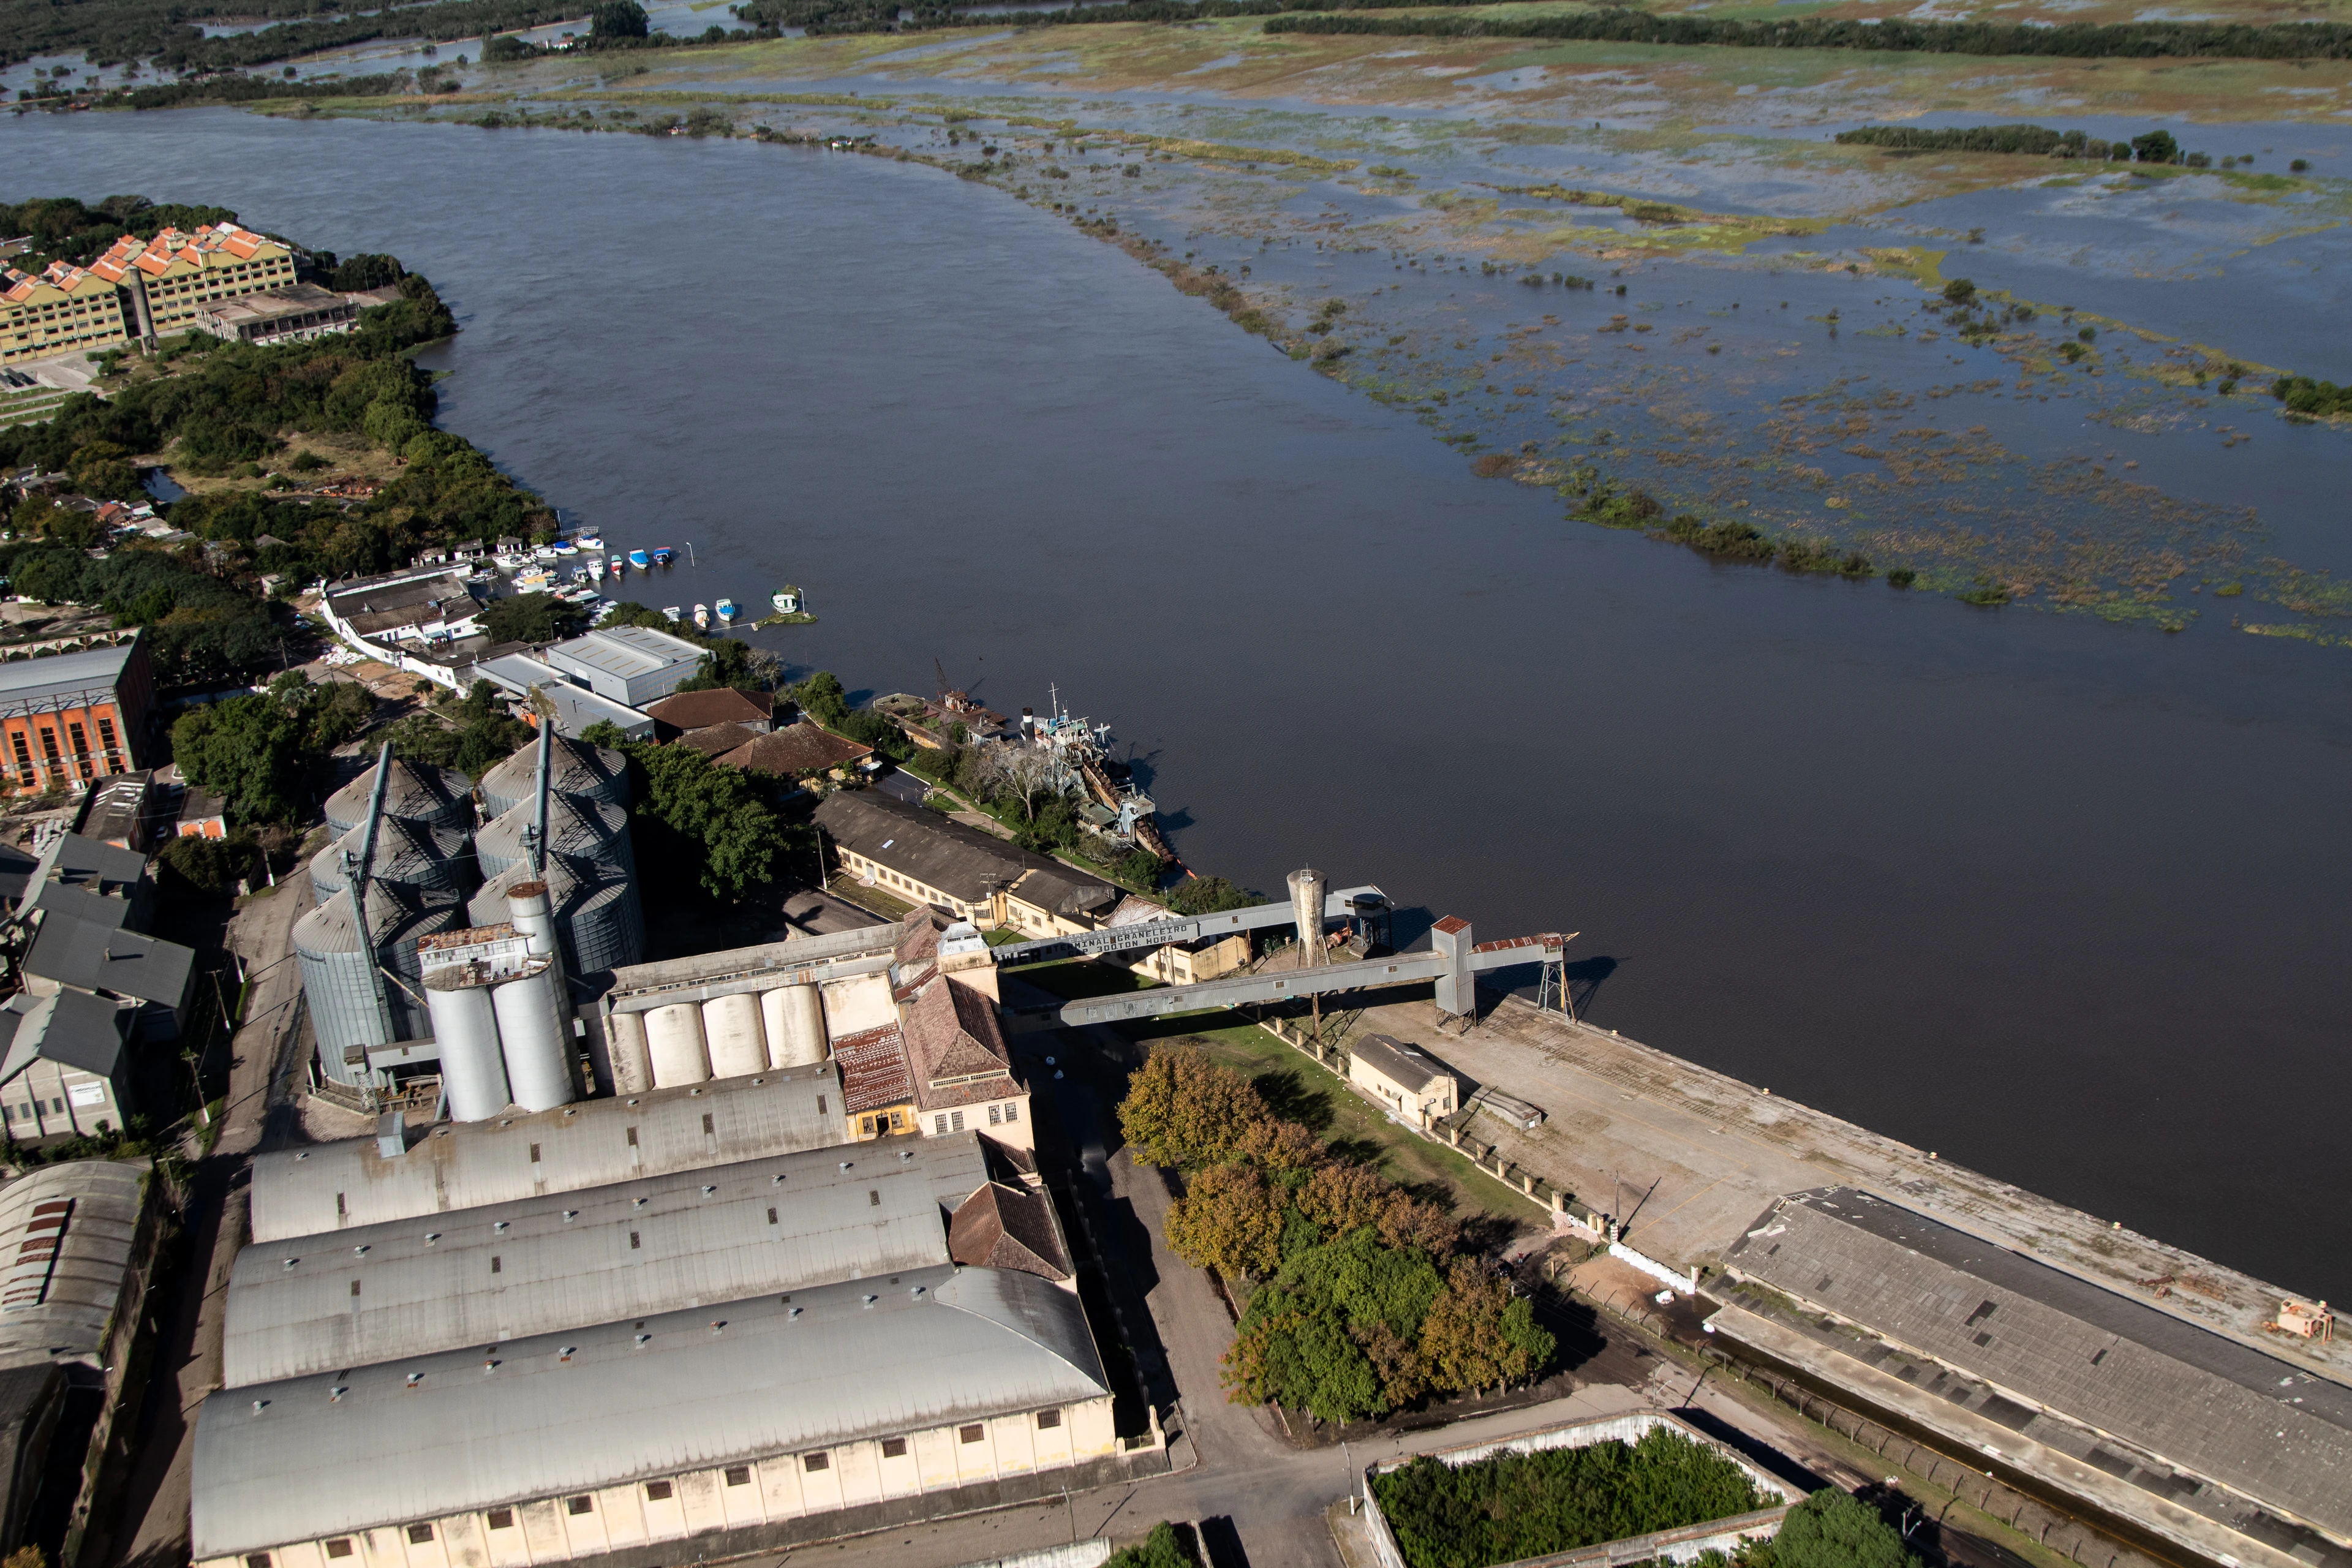
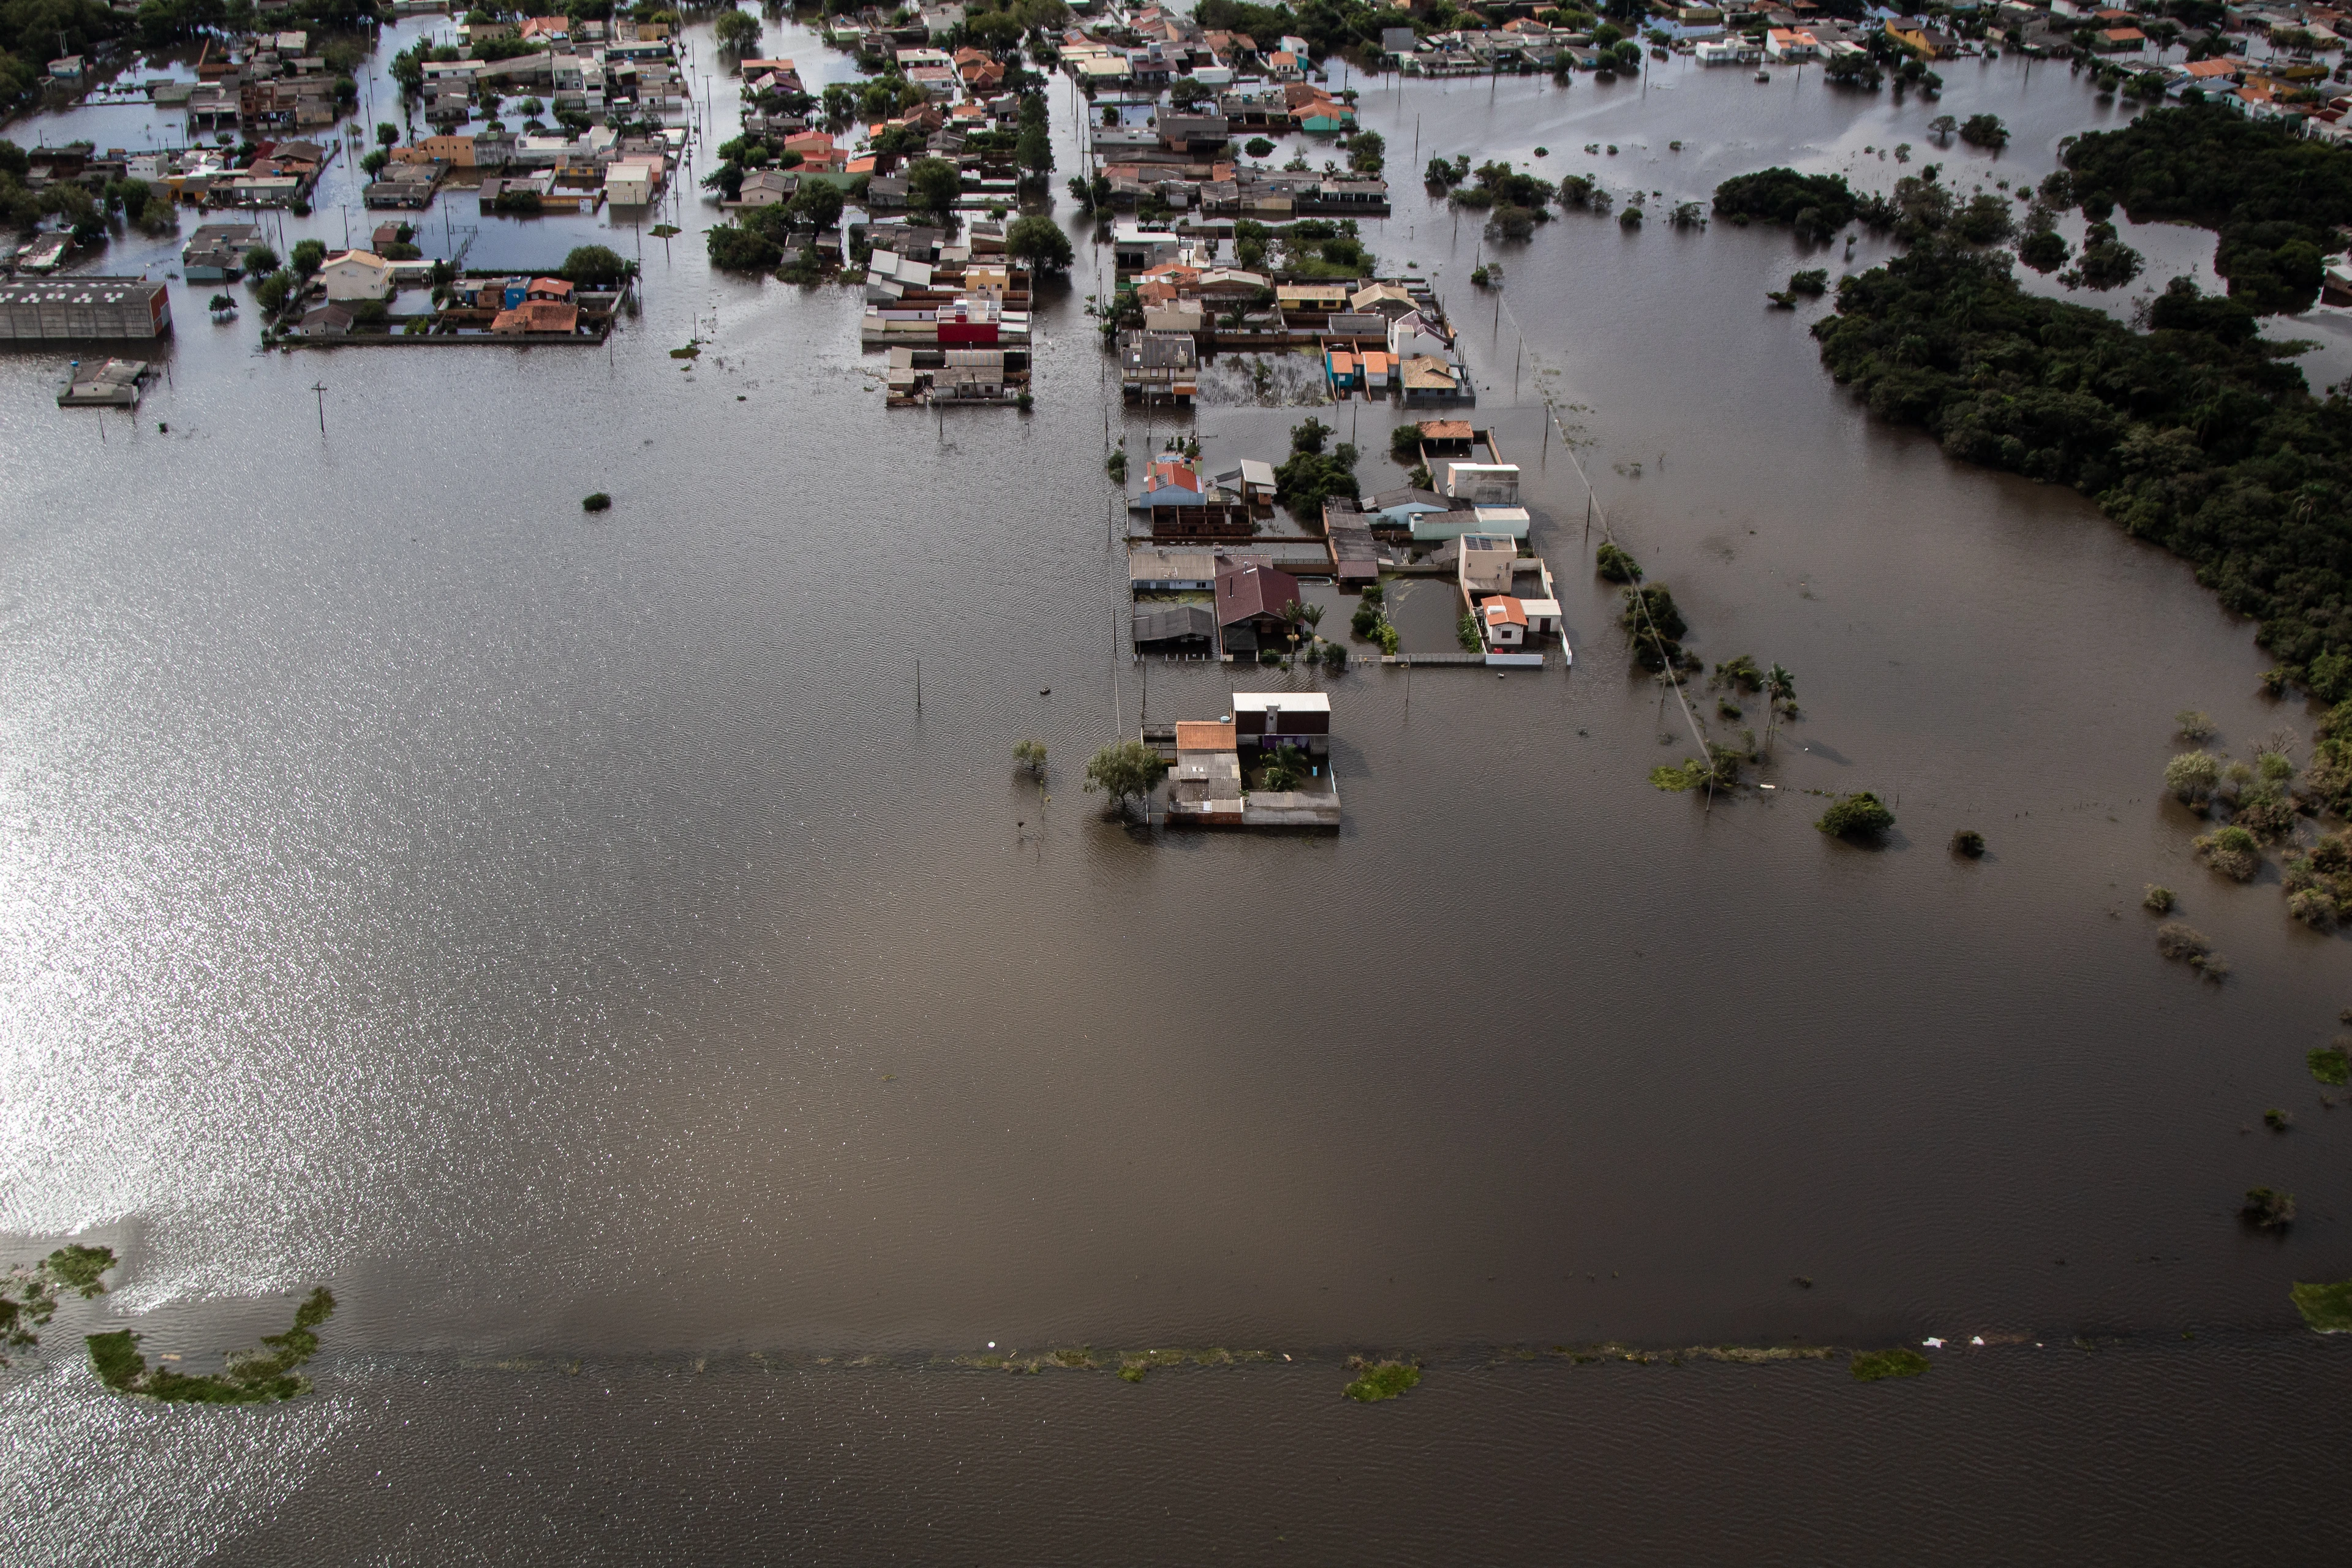
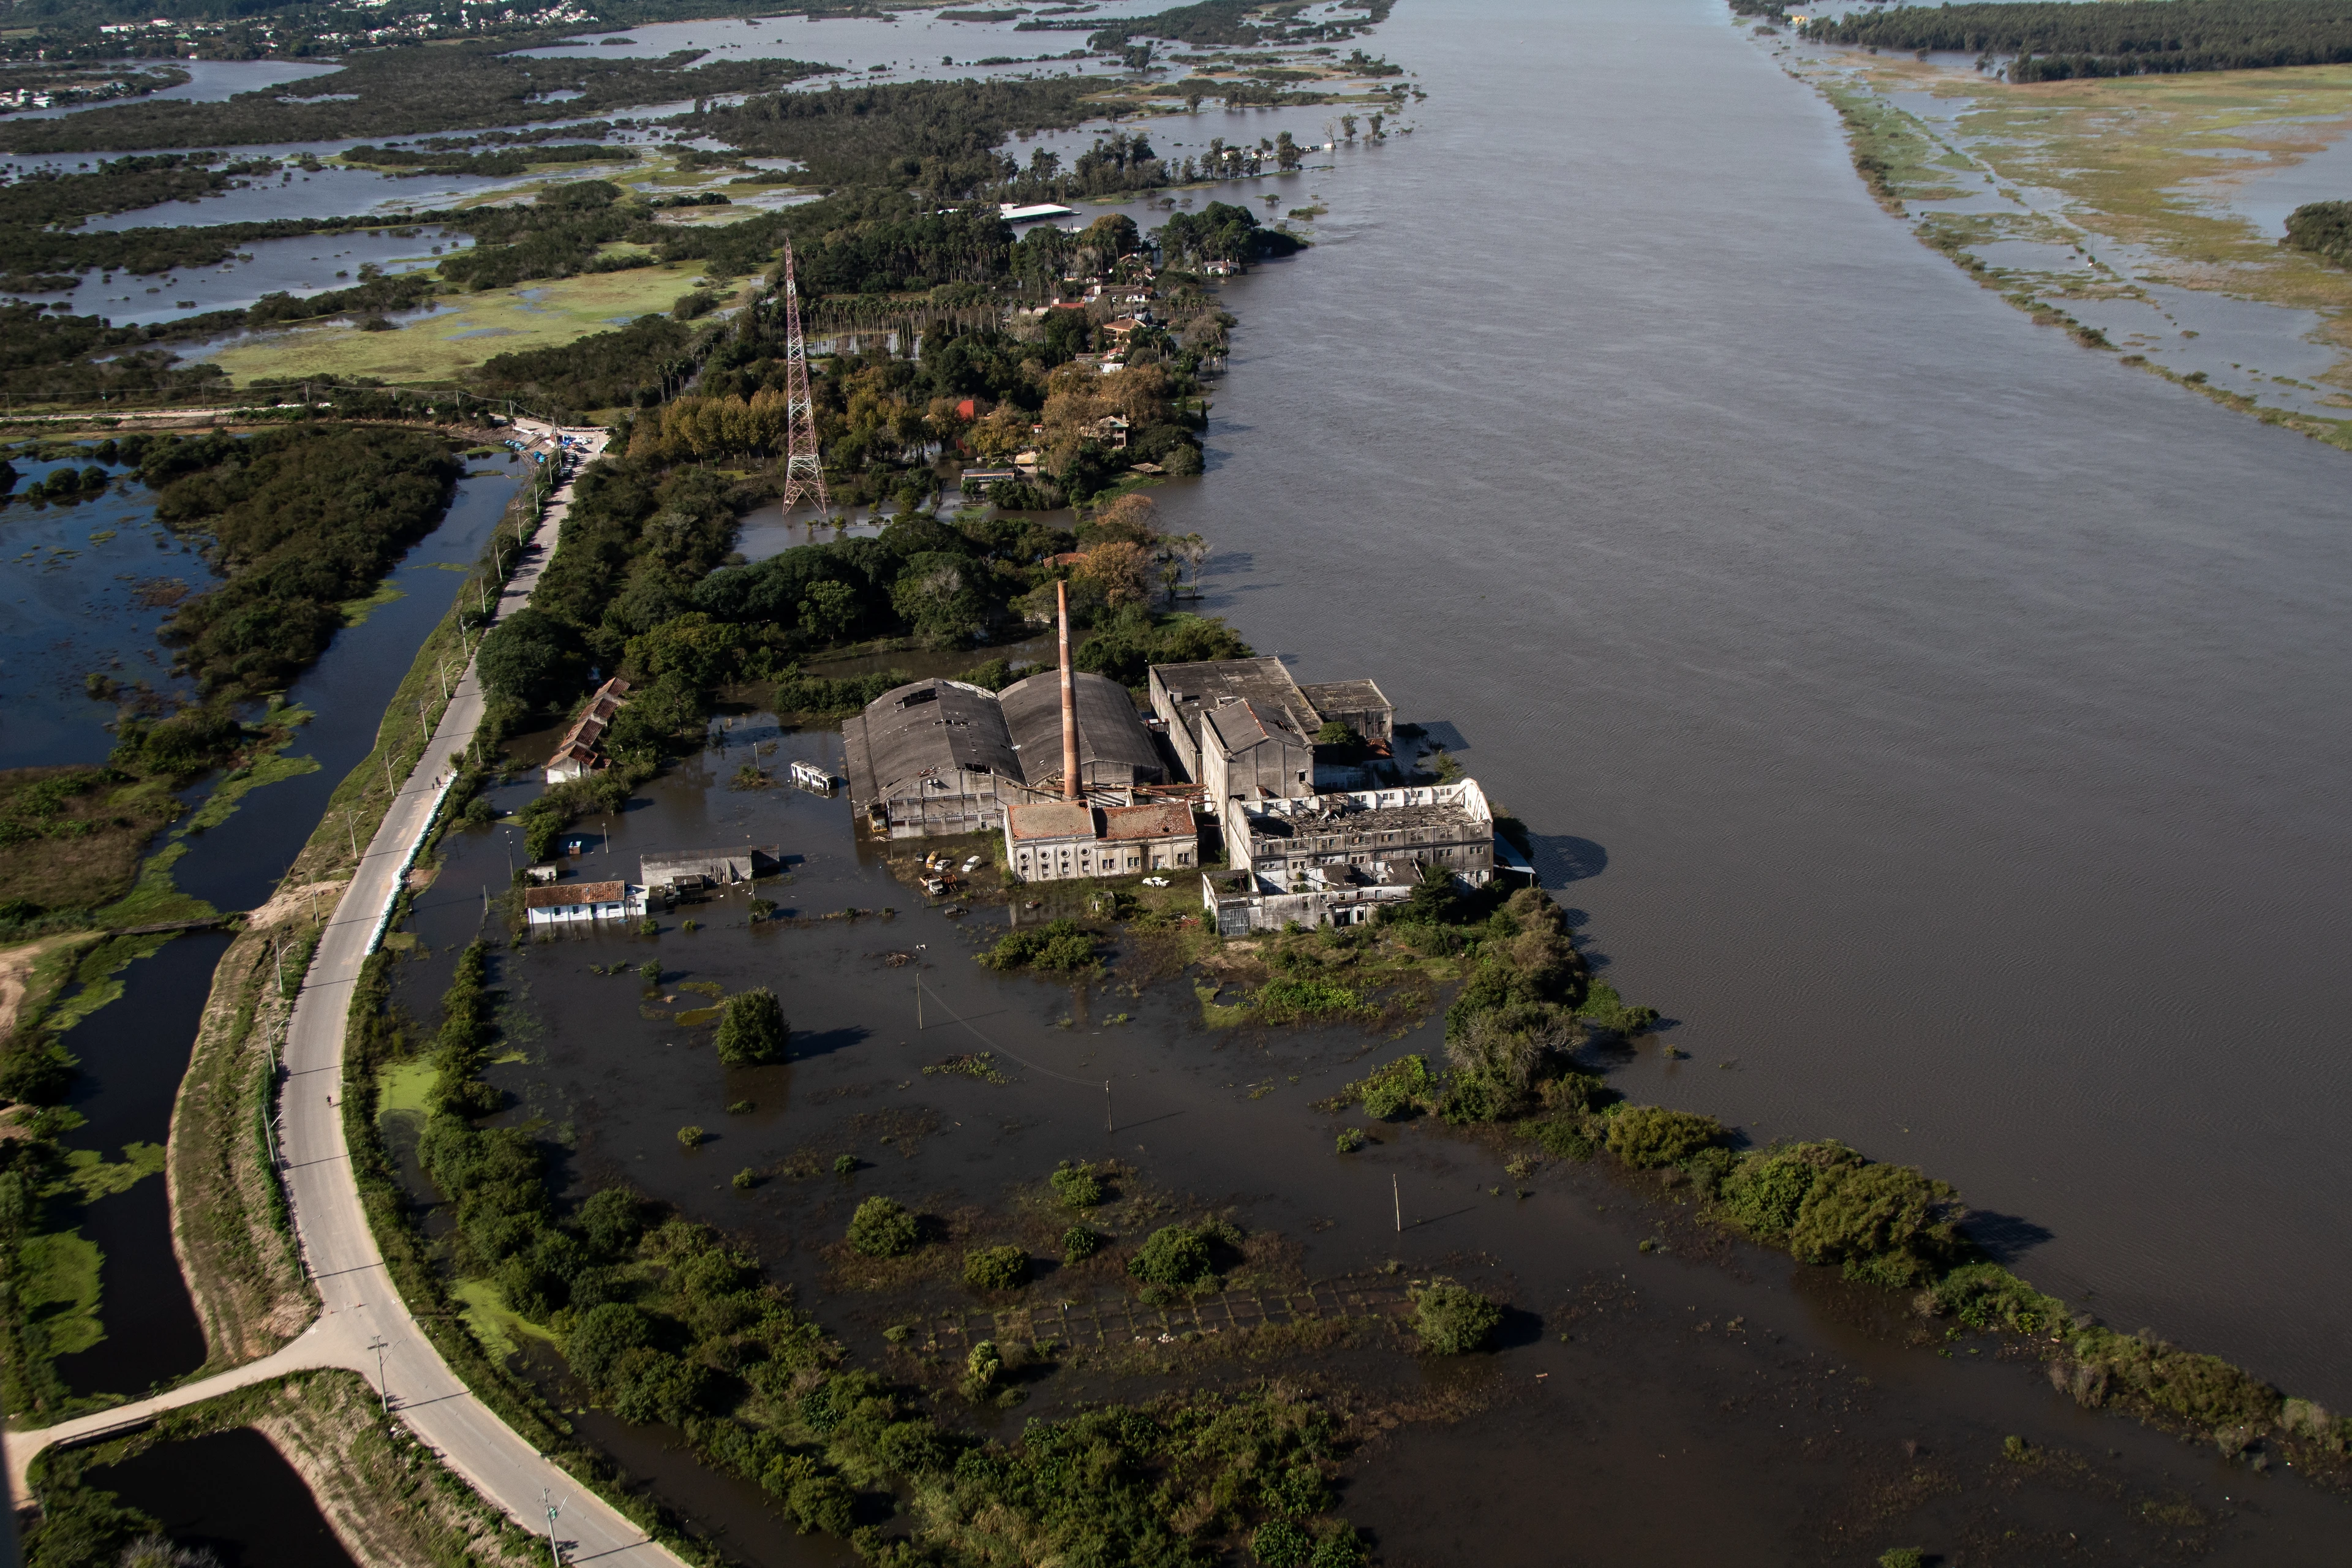
In May 2024, floodwater surrounded riverside warehouses and factories in Pelotas, in Rio Grande do Sul. Damage like that reaches a bank through its borrowers. When floods, drought or extreme heat damage their assets, cost them working time or raise their operating costs, they become less able to repay, and climate risk becomes credit risk.
From the end of 2027, Brazil’s largest banks will report this exposure in CRFR2, an important step that brings physical climate risk into regular reporting. Managing the risk also means understanding how it reaches each asset: where the asset is, how the climate around it could change, and how vulnerable it is to that change. To show what location, scenarios and vulnerability add, Alpha-Klima built a fictional loan book of six borrowers and ten financed sites, with R$ 971 million drawn, and followed it from the CRFR2 tables to default probability and capital. Every step is set out in the accompanying notebook, with the data, assumptions and calculations behind each result.
Explore the full credit-risk notebook
Key findings
- Location changes the picture. Placing lending at the financed sites rather than at borrowers’ headquarters moves 30% of it into another macro-region and changes CRFR2 risk classes in both directions.
- Scenarios and vulnerability put a cost on the hazards. By 2050 on a high-emissions pathway, the book’s expected annual physical loss rises by almost a fifth, and heat brings the largest new cost, mostly through lost working hours at the mills.
- The damage reaches capital. Flooding raises modelled risk-weighted assets by 5–6% by 2050, and the effect keeps growing for loans not yet written.
Location changes the picture
CRFR2 is the physical-risk section of the GRSAC report, in which Brazilian banks disclose their social, environmental and climate-related risks. Its two tables grade exposure to drought (Seca) and intense rain (Chuva Intensa) by macro-region, for today’s climate and a high-emissions future, using AdaptaBrasil’s municipal threat indicators. Under BCB Resolution 586/2026, the largest banks, in segments S1 and S2, report from the 31 December 2027 reference date; S3 banks may defer for a year.
The reporting rules already recognise that location matters. Financing and leasing are reported in the municipality of the financed activity; other lending can use a more precise location where the bank has one, or the borrower’s headquarters. Each exposure’s threat is then read from the indicator for its municipality, giving every bank a common basis.
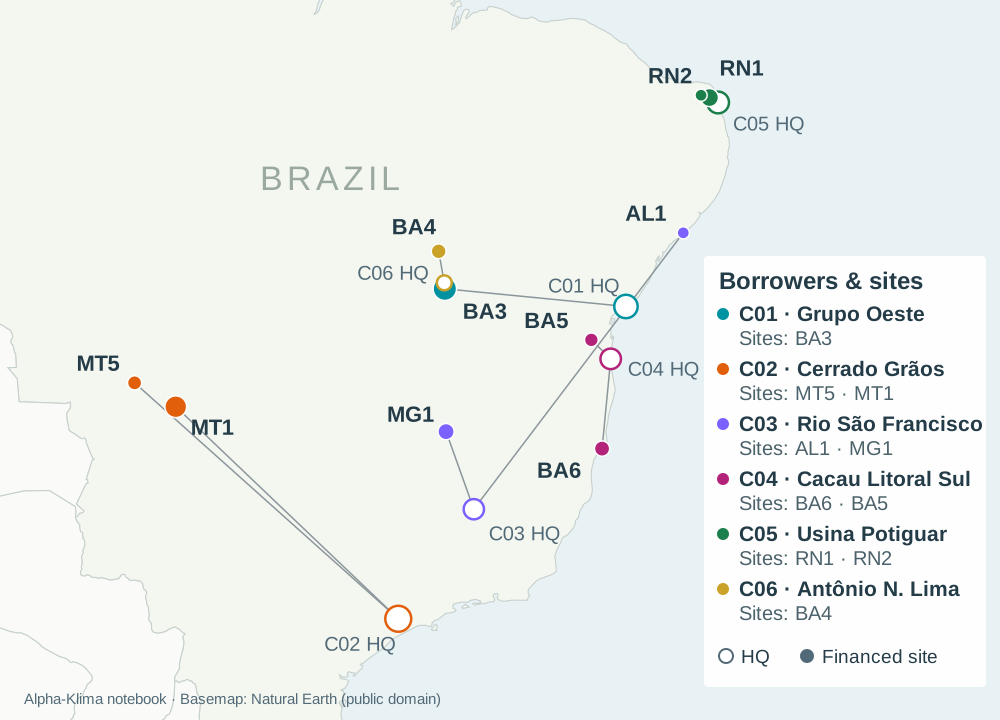
This book shows how much that location can matter. Every borrower finances sites outside its headquarters’ municipality, so reporting at the sites rather than the headquarters moves 30% of the lending into another macro-region and changes nine risk classes, in both directions. The headquarters sit in cities with high urban-flood scores, so the intense-rain threat falls: for corporate borrowers in the Nordeste, today’s class drops from Muito alto to Baixo. The drought threat, meanwhile, rises at more than half of the sites.
Going one step further, to each site’s own coordinates, sharpens the picture again. Several sites in high-scoring municipalities show no river or coastal flooding, while a coastal warehouse in a municipality with a low intense-rain score already faces expected flood damage of 22% of its value a year in 2030. A municipal indicator describes the area, while the coordinates show what the climate means for the asset the bank has actually financed.
Scenarios and vulnerability put a cost on each hazard
Location shows where a hazard can strike, providing an estimate of the frequency at different strenghts. Vulnerability shows what a hazard does to the asset at that location. The Alpha-Klima platform uses vulnerability models to turn the hazard at each site into building damage, lost working time and extra energy use, valued with the site’s own assets and operating costs. Scenarios then show how those costs change over the life of a loan and beyond. Every change below is measured against today’s climate on the high-emissions pathway, SSP5-8.5, or its equivalent RCP8.5 in the flood data; for floods, today means 2030, the first year the projections cover.
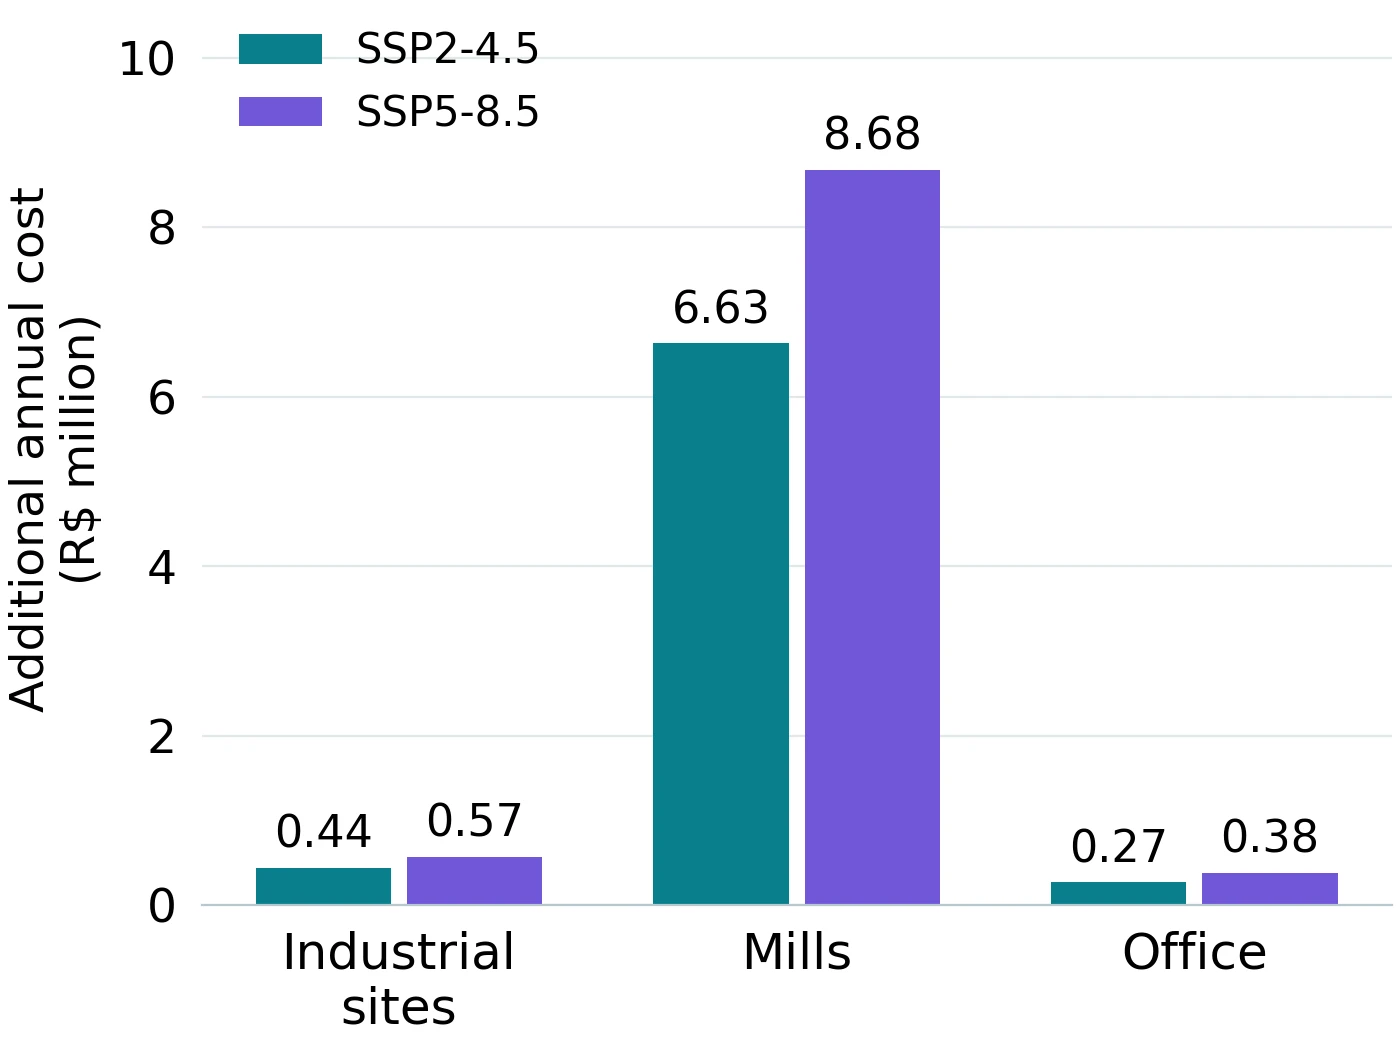
Heat brings the largest new cost. By 2050, the book’s three mills are expected to lose an extra 5–9% of their working hours and productivity to heat, and the office’s cooling bill rises by 70%.
Floods are predicted to worsen too, fastest on the coast, where a flood that occurs once in 100 years in 2030 becomes eight to nine times as frequent by 2050. Along rivers, the change is slower but reaches more sites.
Site losses cannot simply be added up, because one event can hit several sites at once, so they need to be assessed together as a single loss distribution for the book. In an average year today, physical hazards cost the financed sites 2.8% of their value; by 2050, that rises by almost a fifth, to 3.3%.
From physical losses to credit risk
To see how much of this damage reaches the bank, a credit model based on BIS Working Paper 1274 links flood frequency and damage to each borrower’s probability of default (PD), expected loss and risk-weighted assets (RWA), the basis of capital requirements. It covers the five borrowers with flood-exposed sites, which hold three-quarters of the book’s exposure at default.
Flood damage lowers the value of a borrower’s assets and makes default more likely. In a flood year, one borrower’s PD jumps from 9% to 60%. Averaged across all years the effect is smaller, but it builds over time, most of all for the borrowers on the coast.
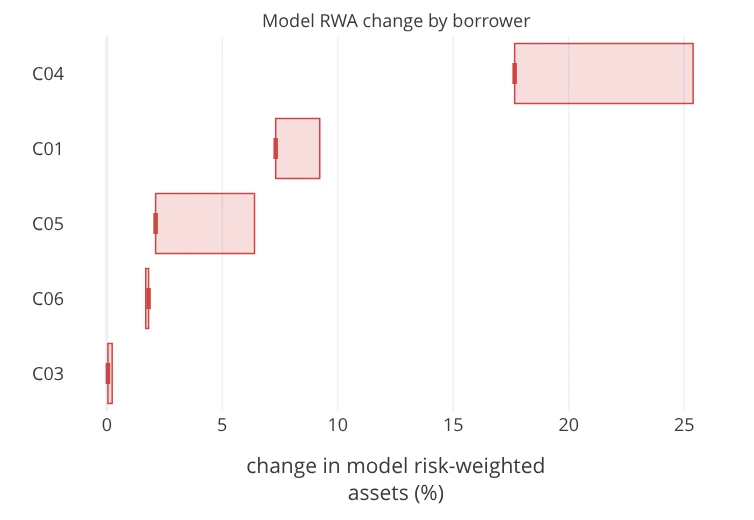
Higher default probabilities feed through to capital. By 2050, modelled RWA rises by 5–6% against the credit model’s baseline, the higher figure assuming recoveries also fall with flood damage. The increase is uneven: for C04, whose port terminal sits on the coast, it reaches 18–25%.
Most of today’s loans will have matured by 2050, and only one of the twelve will still be running, so the 2050 results assume the bank keeps lending to the same borrowers on the same terms. To see what that future lending carries, the notebook prices each of today’s loans as if written in 2028, 2040, 2050 or 2080, with the same size and tenor, and follows the projected flood frequency at the borrower’s sites through every year of the loan’s life. Compared with the same loans under today’s flood frequencies, and with recoveries falling with flood damage, flooding adds 2.5% to the lifetime expected loss of loans written in 2028 and more than a fifth for loans written in 2080.
What this means for lenders
CRFR2 brings physical climate risk into the reporting of Brazil’s largest banks. Location, scenarios and vulnerability turn it into something a bank can act on before an event instead of absorbing afterwards. Knowing where each financed asset sits shows where the risk falls. Scenarios show how it develops over the life of each loan. Vulnerability shows which assets need a closer look and which borrowers to engage on adaptation. Carried into a credit model, the results show how much of the damage reaches the bank, so it can provision, price renewals and plan capital in advance. And because the effect grows for loans not yet written, it matters most for the renewal and new-lending decisions still ahead.
Explore the analysis
The full notebook holds every step: both CRFR2 filings and every cell that changes between them, the site readings beside the municipal indicators CRFR2 uses, the damage and portfolio-loss models, and the credit results by borrower and loan with their recovery and return-period sensitivities.
With Alpha-Klima access, the notebook becomes the starting point for your own analysis: replace the borrowers, sites and loans with your own book and rerun each step ahead of your first CRFR2 reference date.
Where does the physical risk in your own lending sit, and how much of it reaches capital? Book a demo with us to see how Alpha-Klima’s platform combines location, scenarios and vulnerability to trace it from each financed site to default probability and risk-weighted assets.
Request a climate credit-risk demo
Data sources
- WRI Aqueduct Floods – river and coastal flooding, sea-level rise and subsidence.
- ERA5-Land, processed by Alpha-Klima – cooling degree days and drought.
- OS-Climate hazard data – heat stress and working-time loss.
- AdaptaBrasil and the BCB GRSAC reporting framework – municipal indicators and reporting structure.
- BIS Working Paper 1274 – the credit-risk framework.
Keep exploring
Related evidence
El Niño and coffee: From climate signal to business loss
A fictional coffee exporter shows how El Niño can affect harvests, shipping and earnings, and how protection changes the losses a business retains.
Extreme heat as a systemic risk: Europe's 2026 heatwave
An evidence-led analysis of how extreme heat can propagate across assets, infrastructure, communities and economic activity.