
Case study ·
From Rondônia to California: How El Niño puts coffee profits at risk
A dry season can hurt a coffee exporter twice: less coffee to sell, and fewer ways to ship it. In this stress test, a very strong El Niño costs fictional Brazilian producer Café da Manhã 63% of its reference annual EBITDA.
This case study follows that loss from the tropical Pacific to the company’s income statement, an example Alpha-Klima and Lobelia Earth discussed in detail in a joint webinar. Every step is set out in the accompanying notebook, with the data, assumptions and calculations behind each result.
Explore the full stress-test notebook
Key findings
- A very strong El Niño costs 63% of reference EBITDA in an average year: almost five times the loss of a neutral year, and well above the 37% expected when an El Niño’s strength is still unknown.
- Drought drives the loss: a harvest 13% smaller removes more than half of reference EBITDA. Logistic constraints, related to the Madeira river and Panama Canal in this case study, add about 6%.
- Protection depends on timing. If insurance is priced once a very strong event is forecast, drought-index cover costs 36% of reference EBITDA and raises the average loss; however, if bought before any El Niño signal, the same cover would have cost 2% and cut the average loss from 63% to 38%.
How El Niño reaches the business
Café da Manhã grows Robusta coffee on 5,000 hectares in three fields in Rondônia and processes it at four plants. It ships to buyers in California by barge down the Madeira river to Manaus, and then by sea through the Panama Canal to Long Beach.
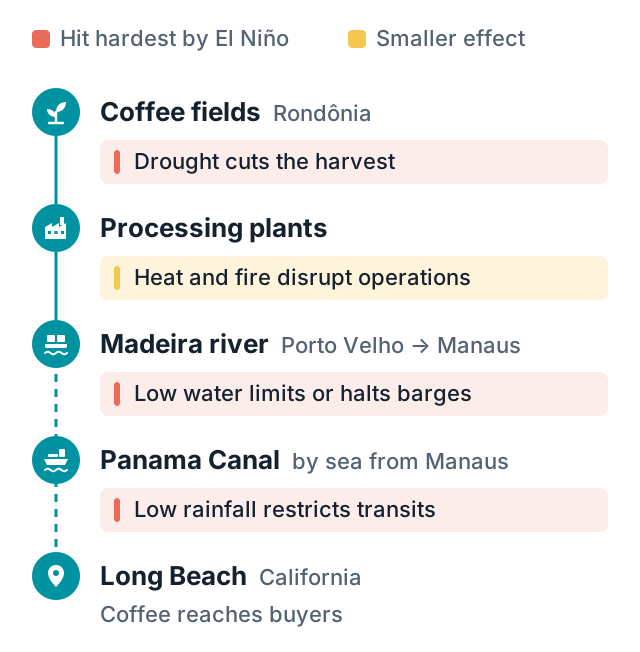
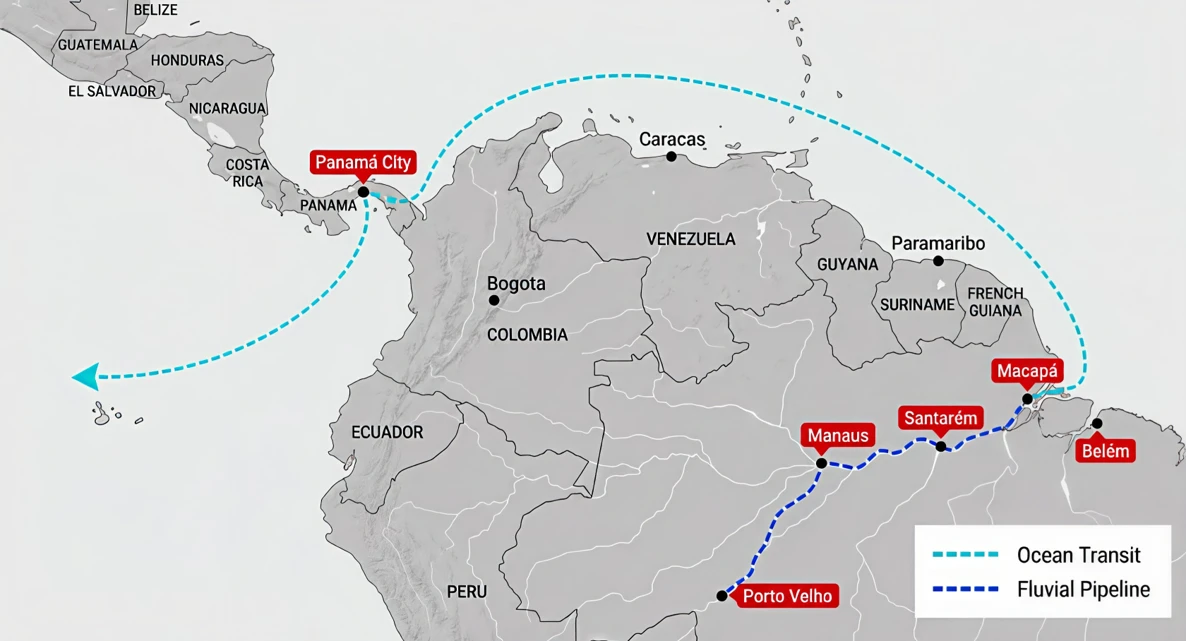
El Niño is a periodic climate pattern that shows up as unusually warm water in the tropical Pacific. Although it forms thousands of kilometres from Rondônia, it reaches every link in this business’ supply chain, hitting the harvest and shipping hardest. In the strongest past events, the rainy season at the fields ended in drought, the Madeira fell lower than usual in the dry season that followed, and the watershed that feeds the Panama Canal’s locks received less rain as the event built up. The Madeira’s low-water level has also been falling for decades, so El Niño now arrives on an already shallower river.
In this stress test for the 2027 harvest and export year we ask how El Niño events of different strengths could affect the company in today’s warmer climate, and then we determine what the business can do to reduce the loss or transfer part of it through insurance. Reference EBITDA, earnings before interest, tax, depreciation and amortisation, for Café da Manhã is US$15.48 million in a normal year on the usual route, a 23% margin on the company’s coffee sales. Every loss below is expressed as a share of this reference figure.
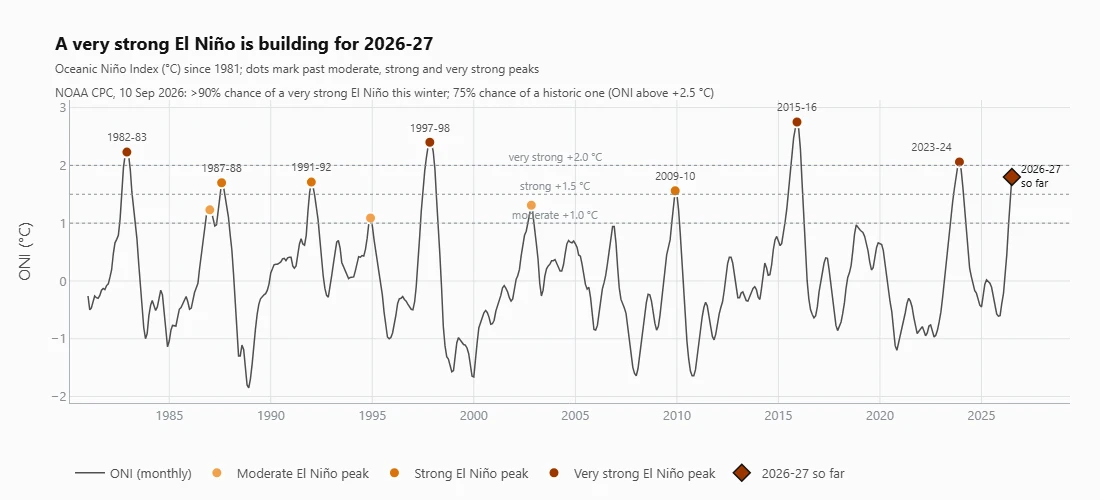
An El Niño of the same strength now occurs against a warmer background climate than in the 1980s. Even without that extra oscillation, the company faces today’s underlying conditions, so we need to update river-level and plant heat-stress trends to 2026 levels. We then use the 1986–2024 seasons to measure each El Niño event class’s average effect in Rondônia relative to neutral comparison years, and recreate it over the 2027 baseline by simulating 1,000 years with different El Niño intensities based on the samples on record. NOAA’s September 2026 outlook predicts a very strong event, which would place it in the same category as 1997–98, 2015–16 and 2023–24, the three events since 1986 classified as very strong by the traditional Oceanic Niño Index.
Event strength changes the earnings outlook
Knowing that an El Niño is coming is only part of the picture; its strength matters more. The chart compares the nine moderate, strong and very strong events in 1986–2024 with the other 30 seasons, showing how the signal reaches the fields and shipping route.
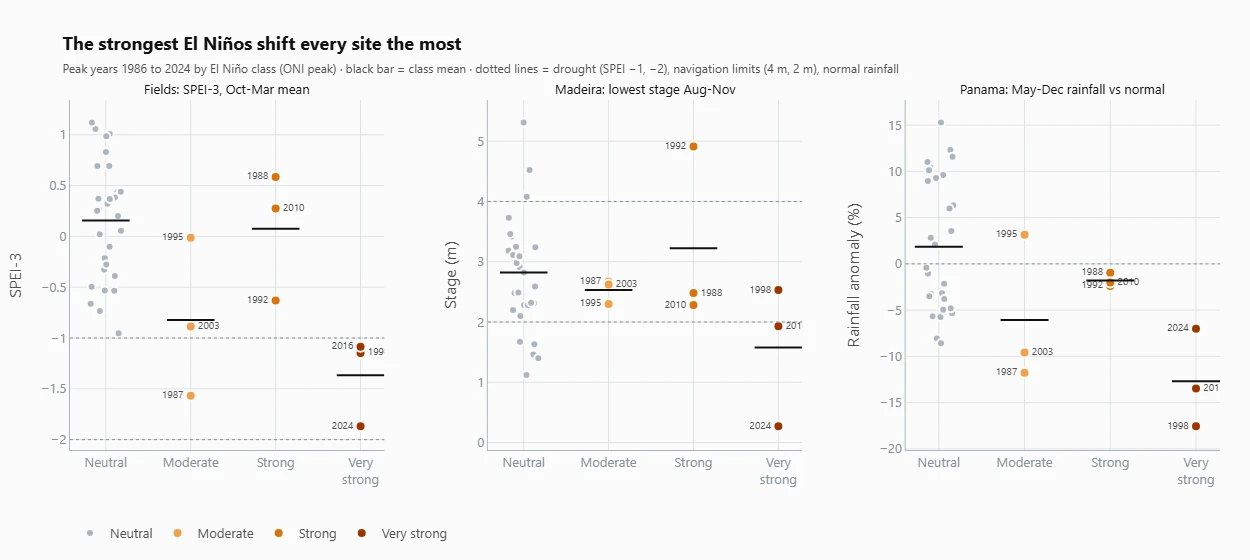
Drought at the fields and a rainfall deficit at the canal coincided in all three very strong events, alongside the lowest average river level of any event class. The stress test therefore sets a neutral year beside two cases: an El Niño of unknown strength, built from all nine events, and a very strong one.
The table shows each scenario’s loss as a share of reference EBITDA. The final column averages the worst 5% of simulated years, a measure of the funding pressure that severe seasons could create.
| Scenario | Average loss | Average loss in worst 5% of years |
|---|---|---|
| Neutral year | 13% | 62% |
| El Niño, strength unknown | 37% | 94% |
| Very strong El Niño | 63% | 117% |
Even a neutral year brings occasional drought and shipping constraints in the warmer climate of the present day, but a very strong El Niño raises the average loss almost fivefold, while the worst 5% of years cost more than a full year’s reference EBITDA. Those severe seasons create the greatest funding pressure, threatening the liquidity and even the viability of the business.
Drought dominates losses, but transport adds pressure
Drought causes most of the loss. The drought response reflects coffee field trials that are calibrated to the expected drought conditions in our forecasted scenarios.
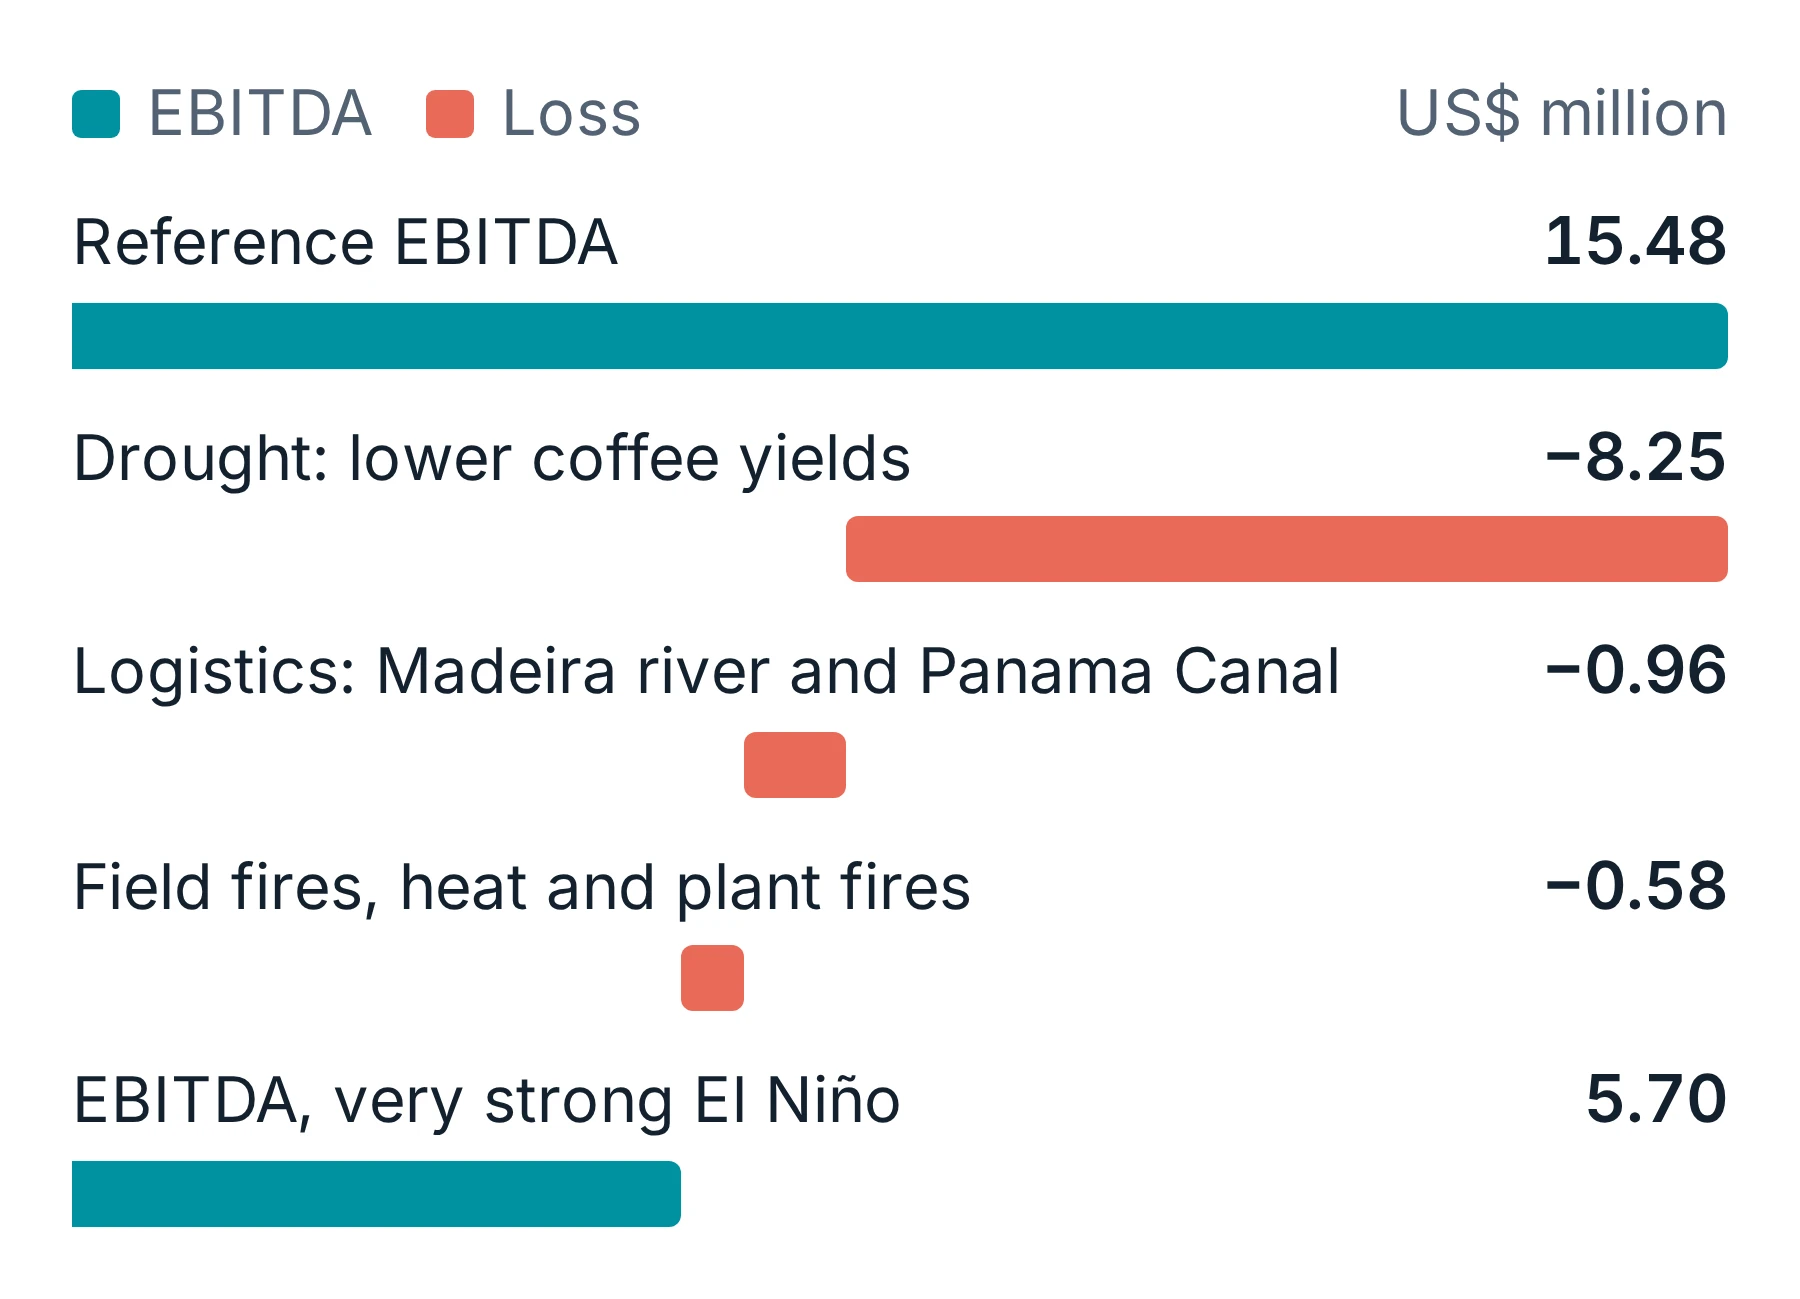
Shipping constraints add another 6% of reference EBITDA. Locally in Rondônia, low water reduces barge loads on the Madeira and can halt navigation, while limited water at the Panama Canal restricts onward capacity heading to California. Under these scenarios coffee must move to more expensive routes and accounts for 10% of the total loss. Heat stress and wildfire account for the remaining 6%.
Timing decides what insurance is worth
Once the loss is measured, a business can respond in three ways: adapt its operations, transfer part of the loss through insurance, or hold enough capital to stay in business through the loss.
For Café da Manhã, adapting does little, but insurance can help transfer part of the risk. The notebook tests a drought-index cover that pays out when the rainy season at the fields turns to drought. In the model, the premium reflects the losses insurers expect at the time the cover is bought. The table shows the very strong scenario with the cover bought at three points as the El Niño signal firms up. Losses include the premium, and all figures are expressed as percentages of reference EBITDA.
| Drought cover bought | Premium | Average loss | Average loss in worst 5% of years |
|---|---|---|---|
| No cover | None | 63% | 117% |
| Before any El Niño signal | 2% | 38% | 75% |
| Once an El Niño is declared | 17% | 53% | 90% |
| Once a very strong event is forecast | 36% | 71% | 109% |
Bought before any signal, the cover is priced on a normal year: it costs little and takes more than a third off the worst years. Each later price carries more of the coming loss, and once a very strong event is forecast the premium covers the full expected payout plus the insurer’s margin, so the cover raises the average loss above the 63% the company would carry uninsured. The conclusion is that cheap protection has to be in place before the forecast, not bought in response to it.
El Niño outlooks typically give several months of warning, and the expected strength becomes clearer as the event develops. Even when the strength signal is already in the insurance price, companies still have time to plan for the loss before it arrives, whether through provisions or a liquidity buffer for the export year.
Explore the analysis
The full notebook contains the hazard histories, loss curves, routing assumptions and protection options. It also reports value at risk and expected shortfall. The joint webinar with Lobelia Earth walks through the example.
Questions about the notebook, or ready to run it on your own assets? Contact us and we will help.
With an active Alpha-Klima subscription you can use the notebook to change the assets, routes, event strength or cover and see how the losses respond. To see how this approach applies to your own business, request a supply-chain climate-risk demo.
Prefer a guided tour? The webinar recording walks through the example with Lobelia Earth.
Data sources
- NOAA Oceanic Niño Index and ENSO outlook – historical El Niño event classification and the expected strength of the 2026–27 event.
- ERA5-Land, C3S/ECMWF, and Alpha-Klima climate indicators – drought, fire weather, heat stress and canal-watershed rainfall. Aggregated layers are available on the Alpha-Klima platform.
- MODIS burned area, NASA – fire exposure around fields and plants.
- ANA HidroWeb – daily Madeira river levels at Porto Velho, station 15400000.
- IBGE SIDRA table 1613 – municipal coffee yields used for calibration.
- Panama Canal Authority – navigation restrictions during El Niño. The notebook lists the operating records and studies used for each channel.
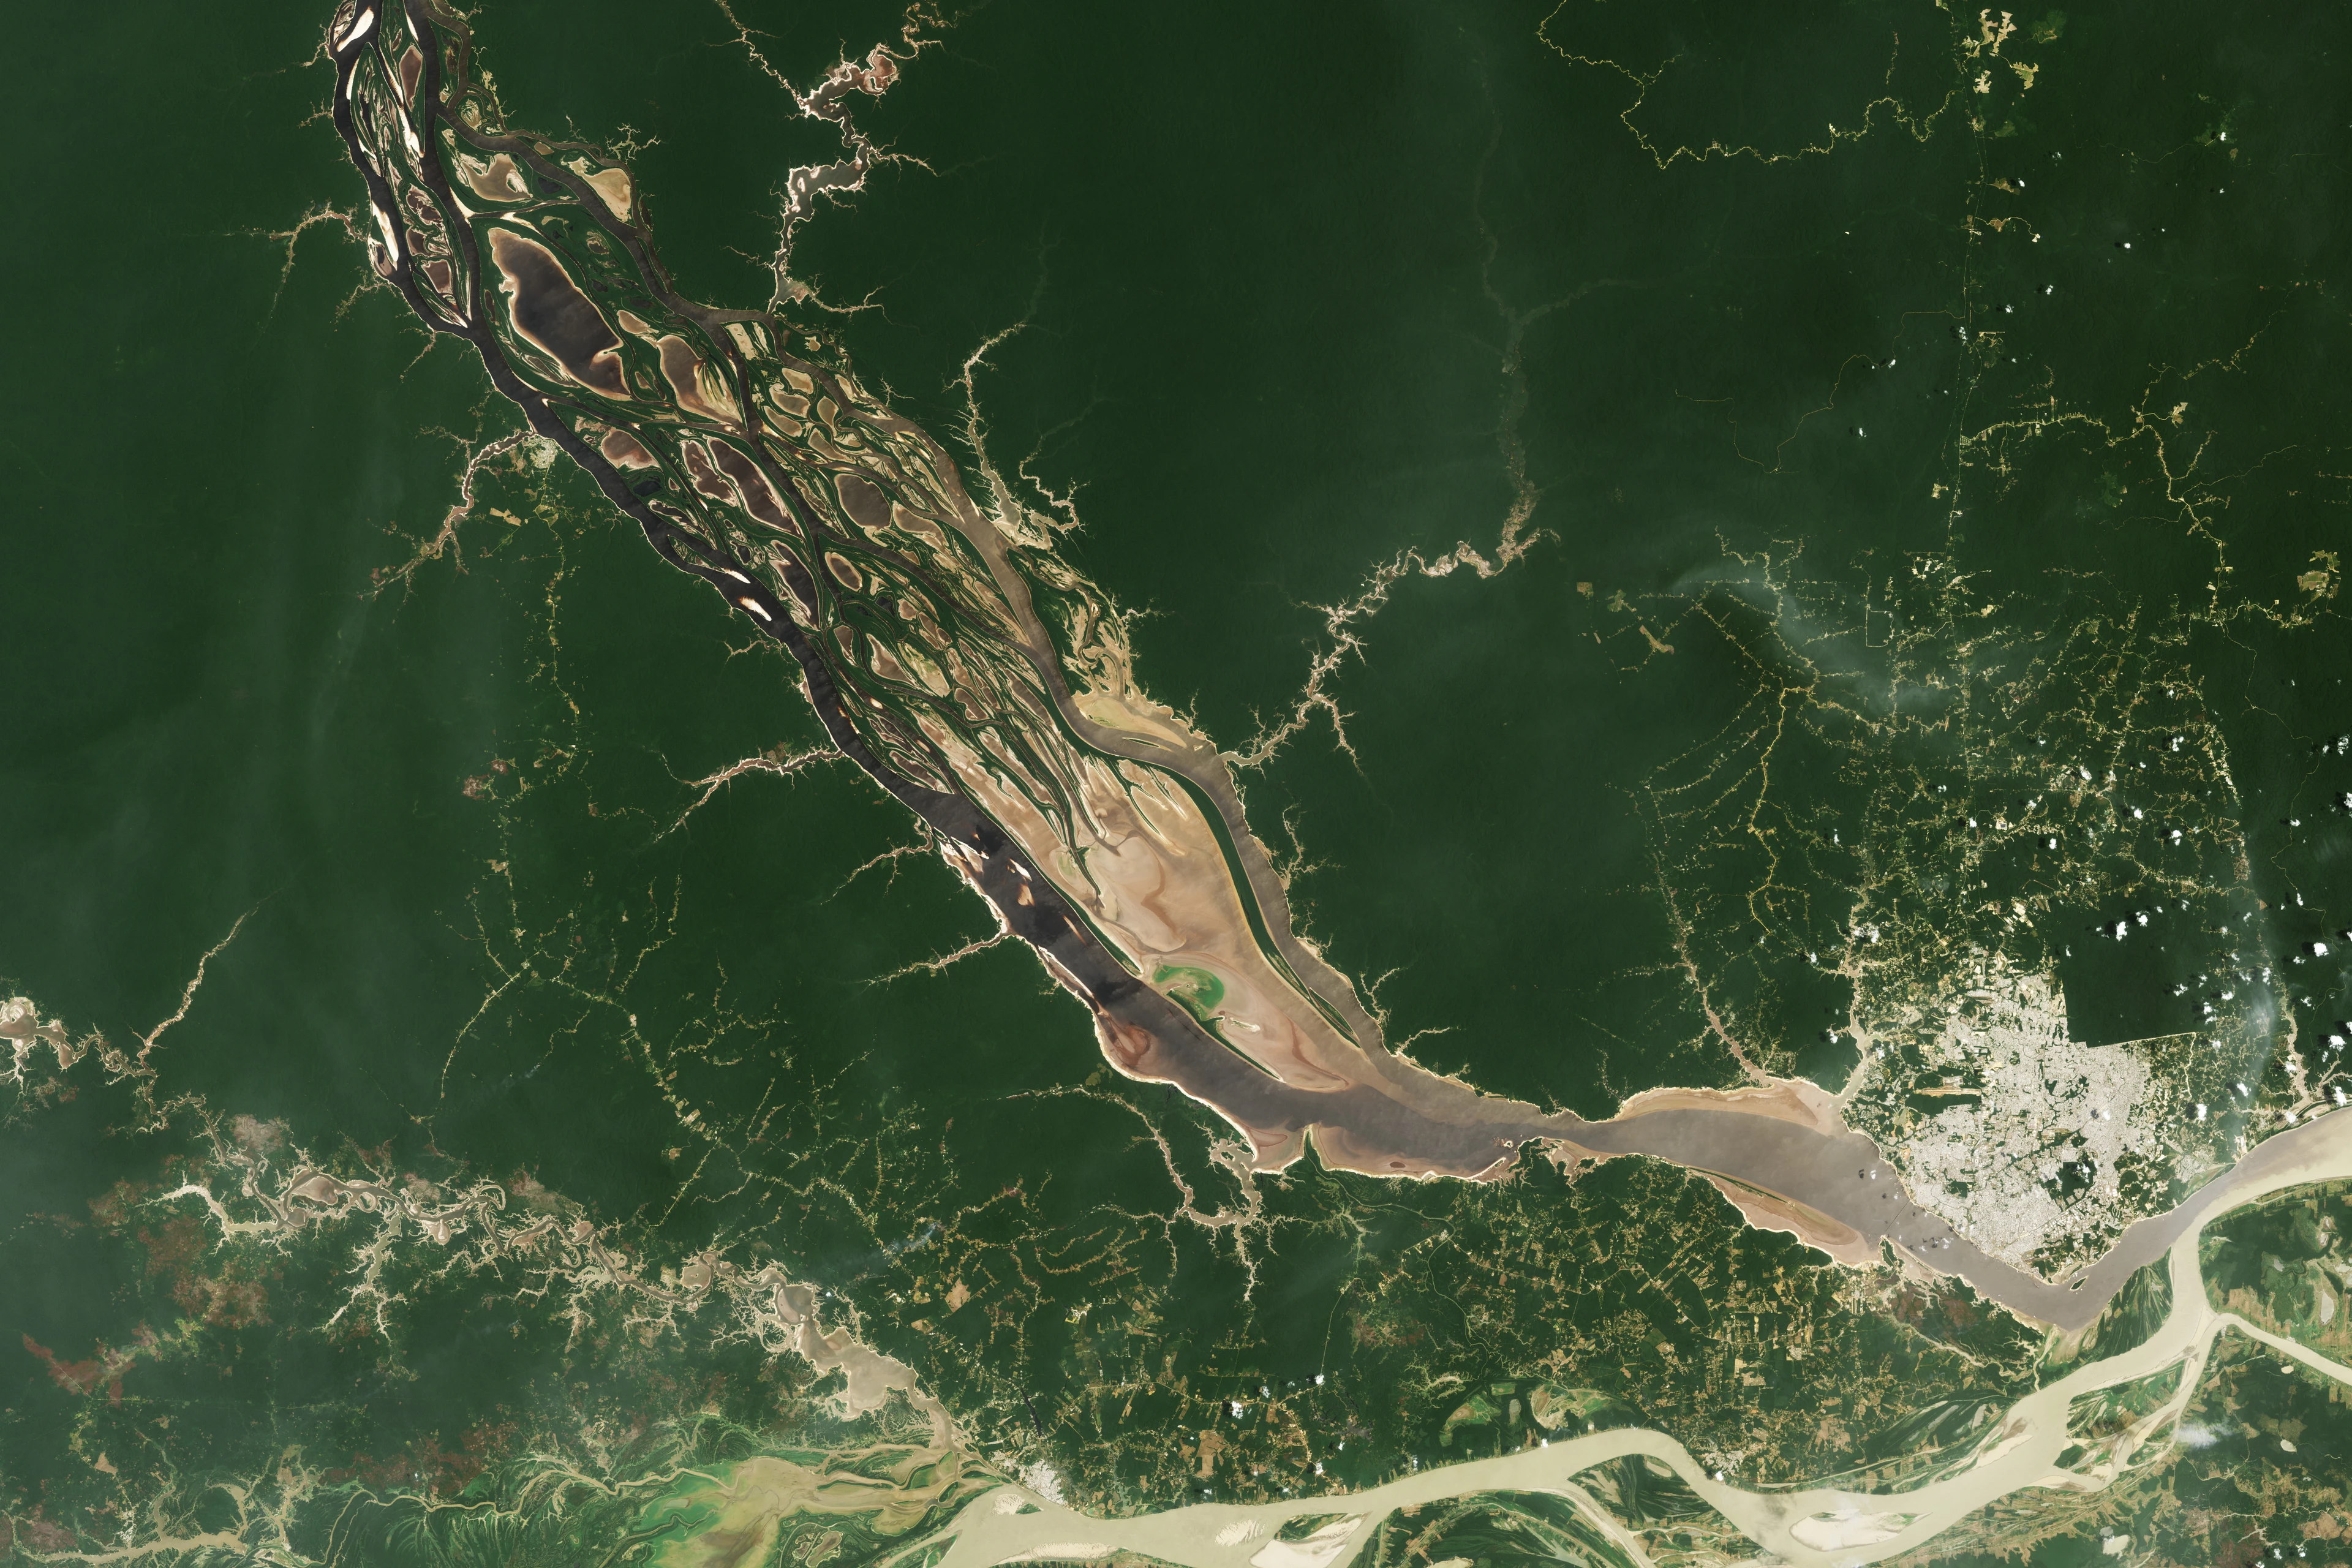
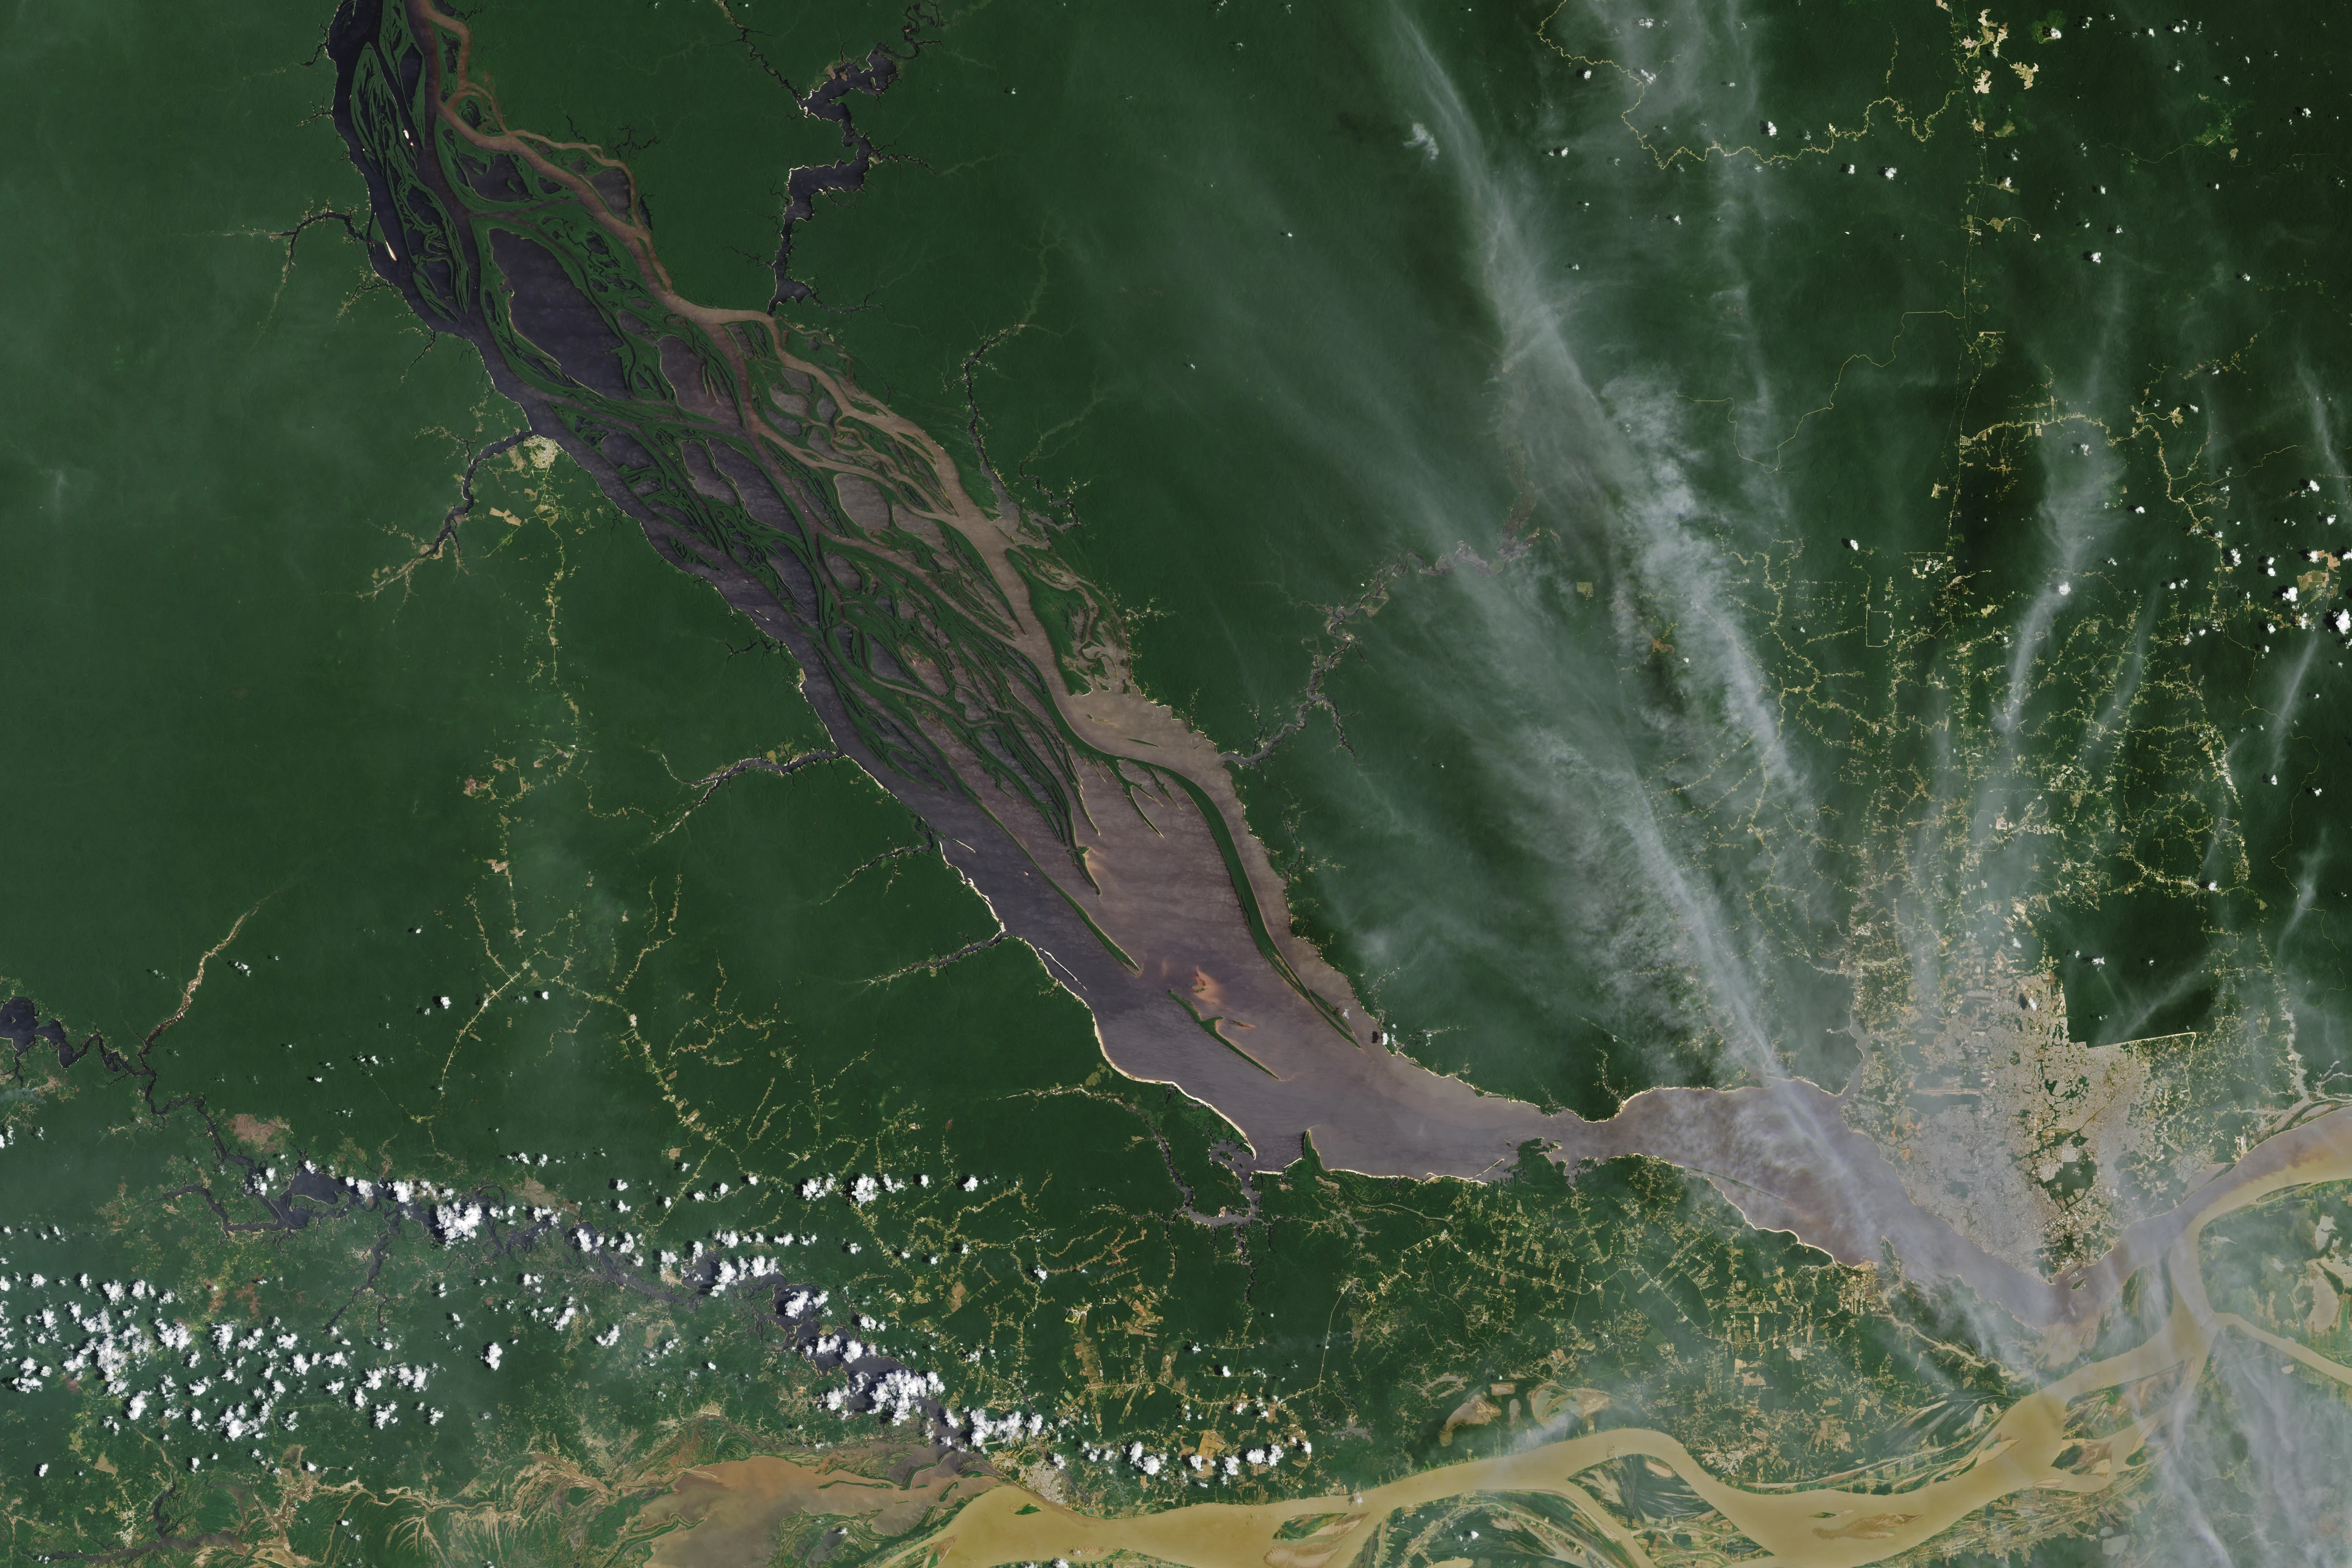
- Header images: NASA Earth Observatory images by Wanmei Liang, using Landsat data from the U.S. Geological Survey.
Keep exploring
Related evidence
Webinar: El Niño's financial impact
Lobelia Earth and Alpha-Klima follow El Niño from climate signal to financial decision, using a fictional Brazilian coffee exporter as the case.
Physical climate risk in a Brazilian credit book
A synthetic Brazilian loan book shows how location, climate scenarios and asset vulnerability carry physical risk from CRFR2 reporting to credit risk.